Thesis Insights
Backed By Evidence
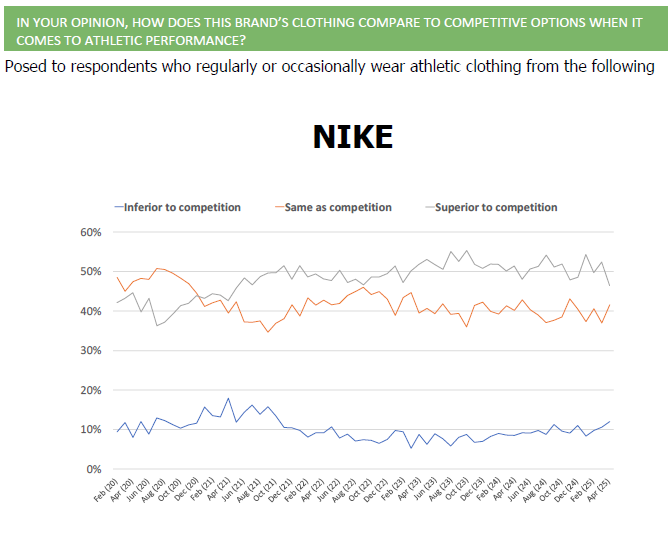
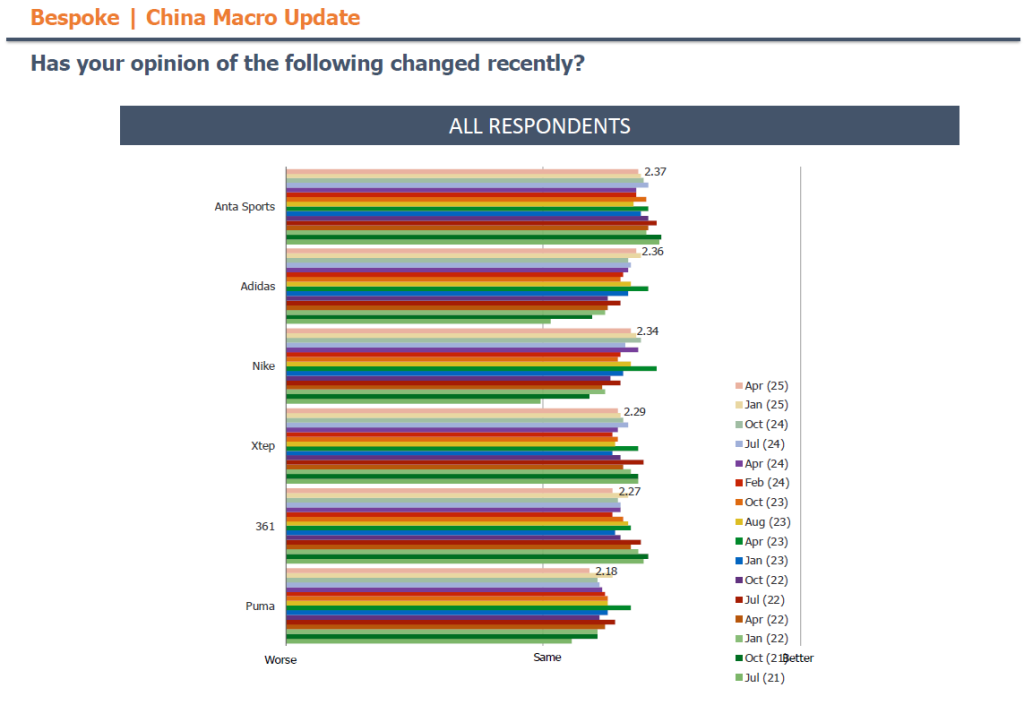
(NKE) Survey Data, US and China
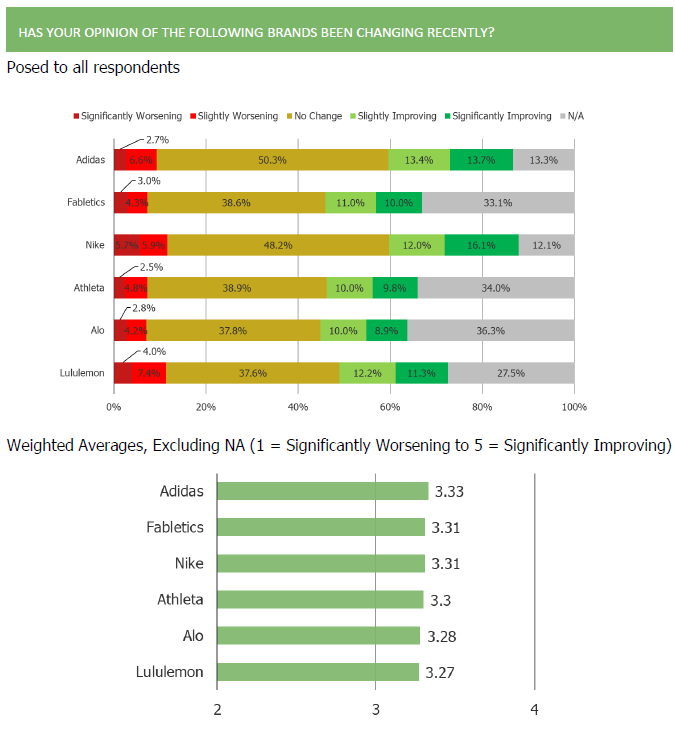
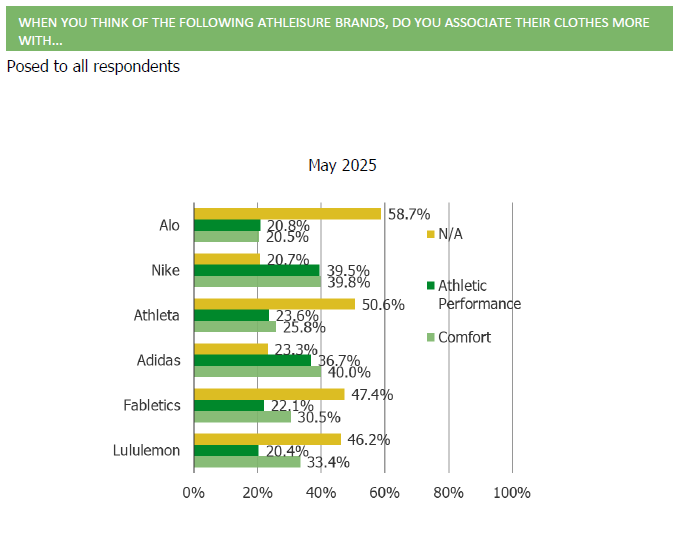
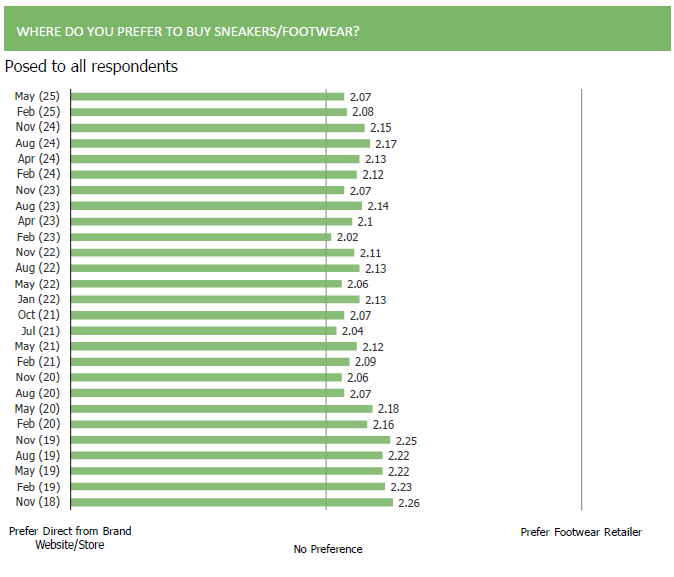
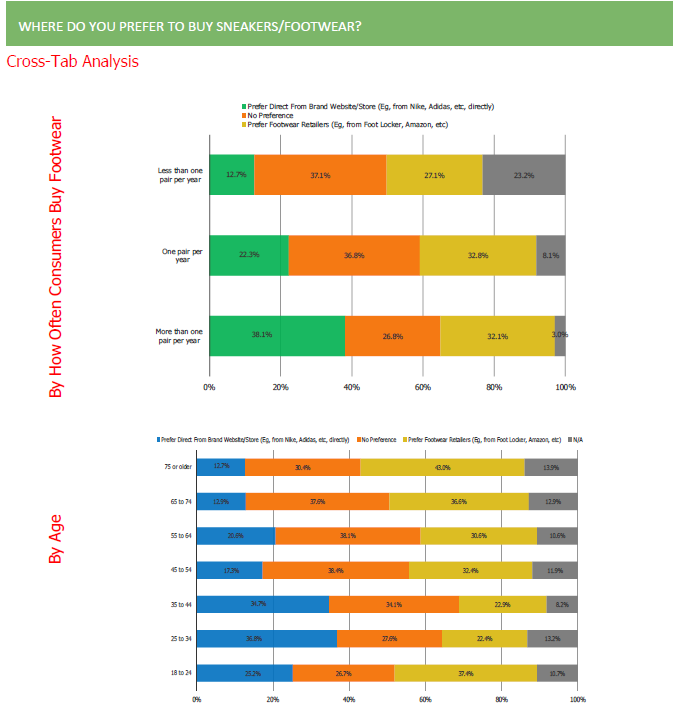
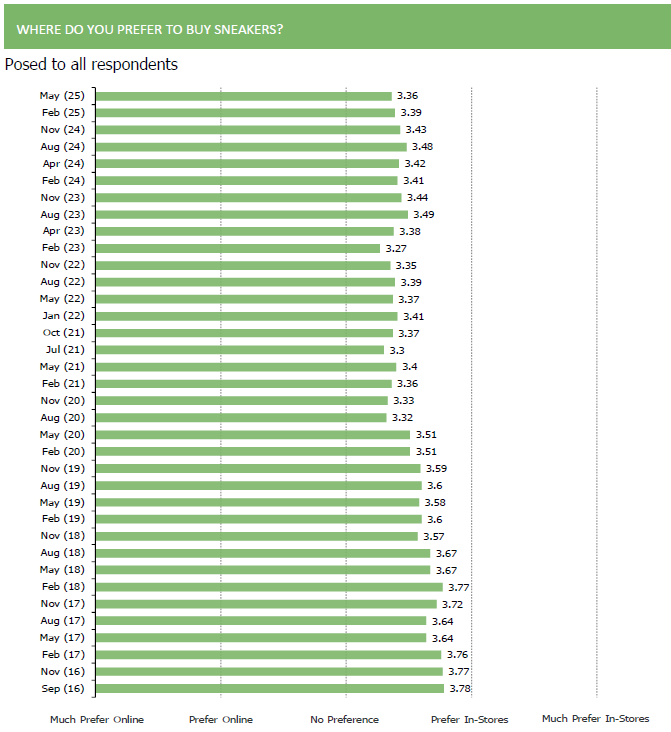
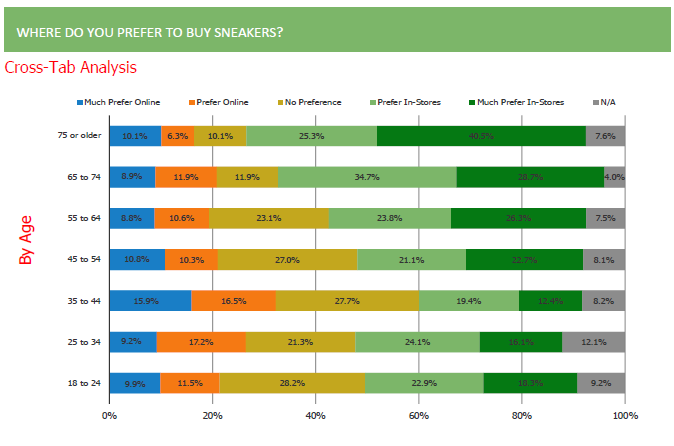
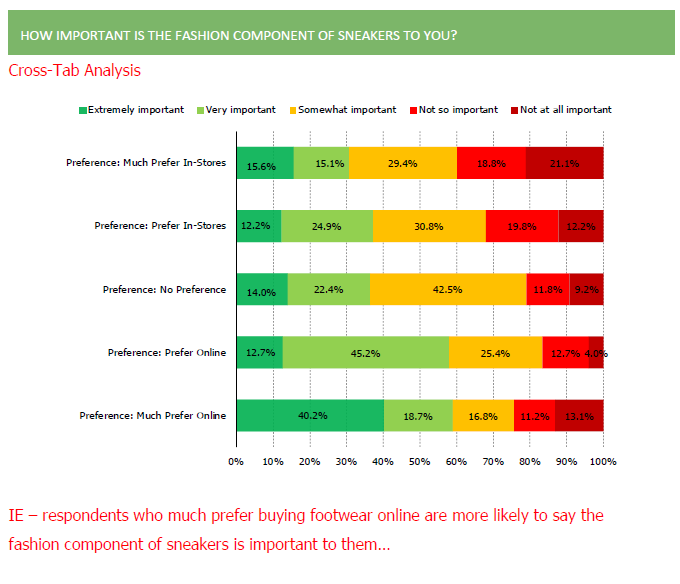


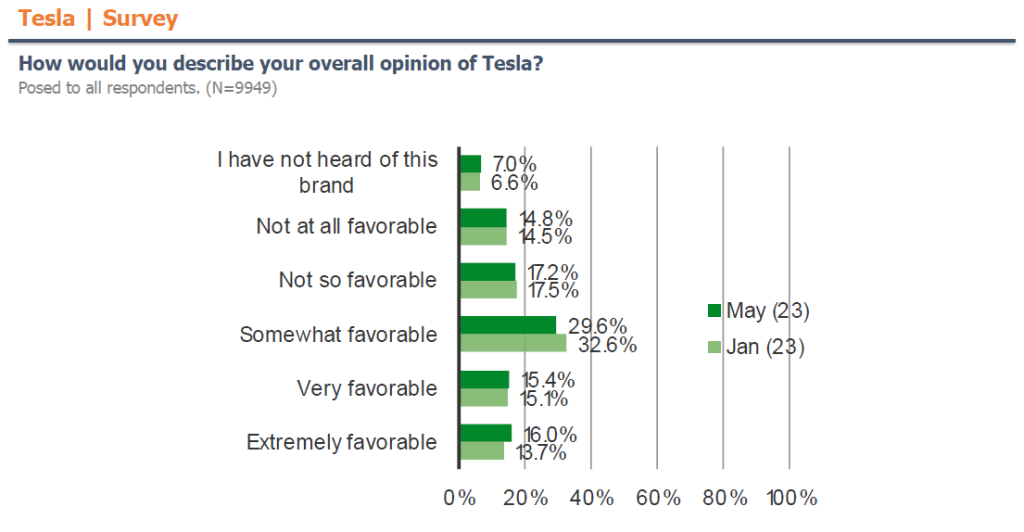
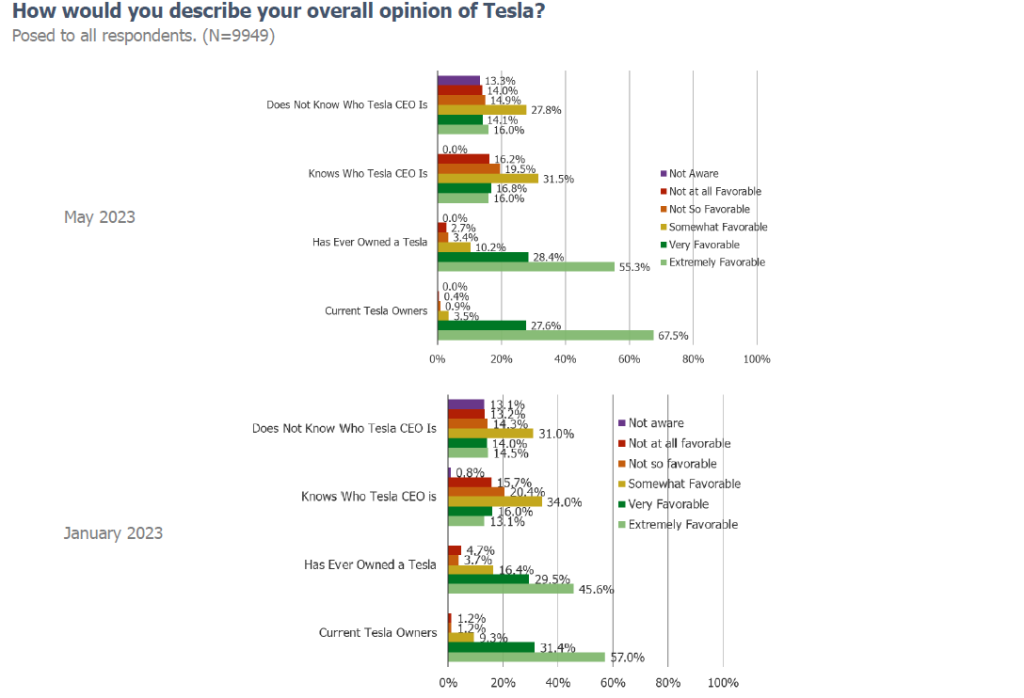
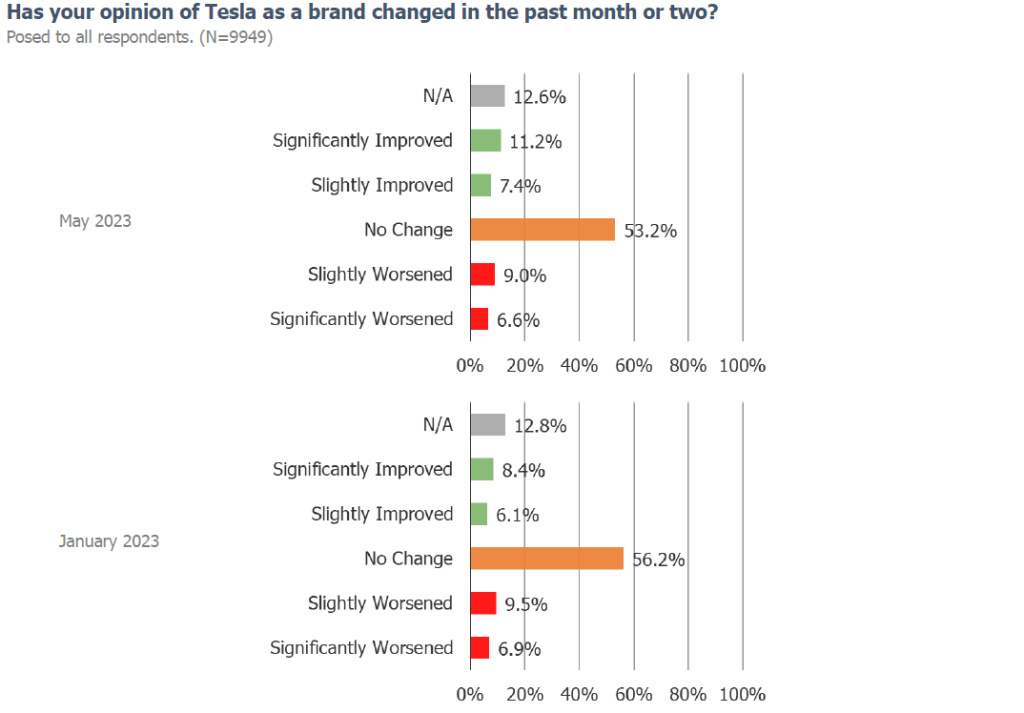
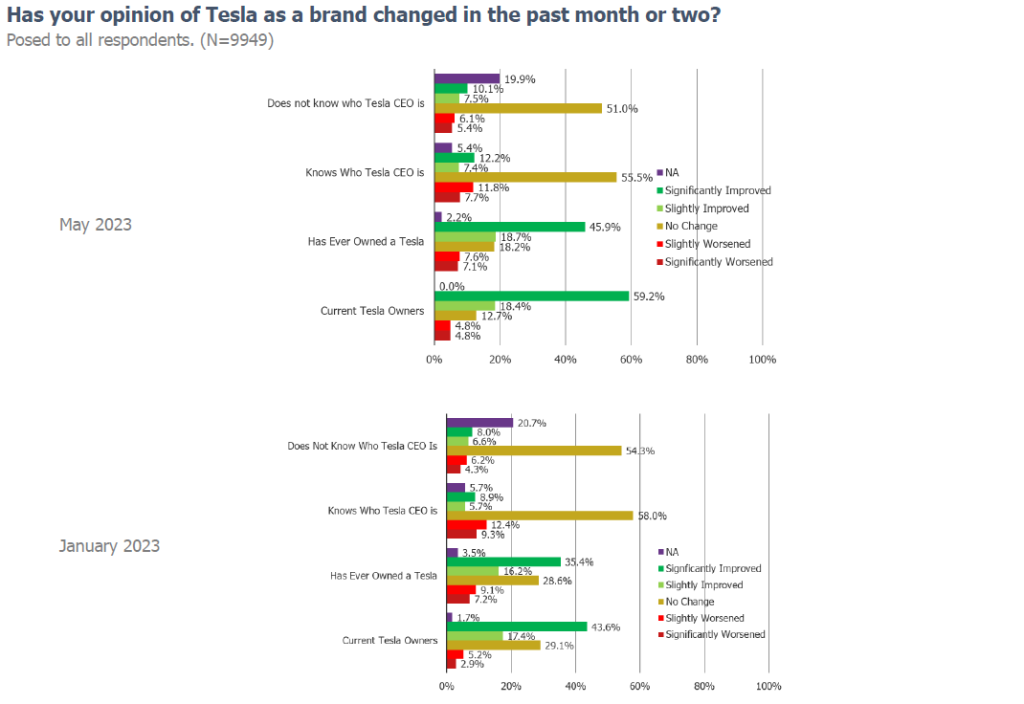
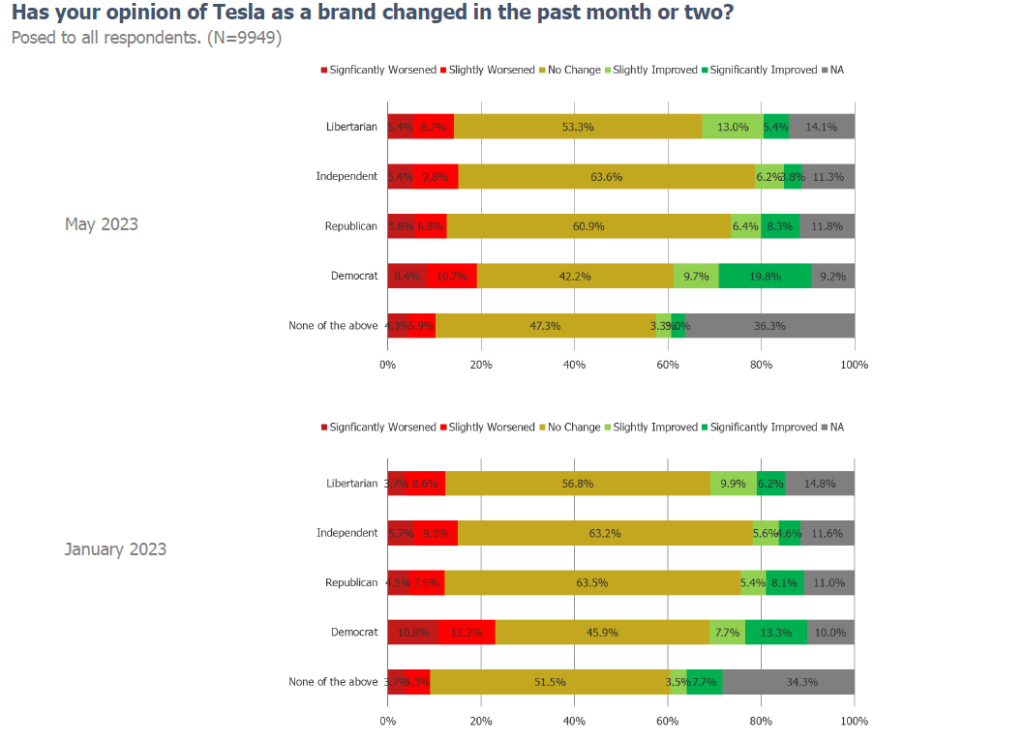
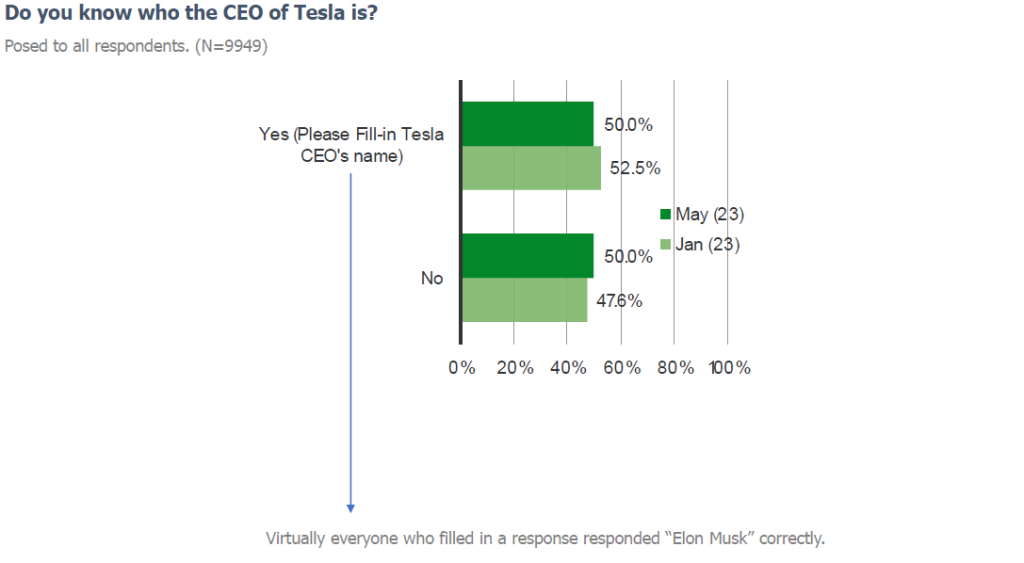
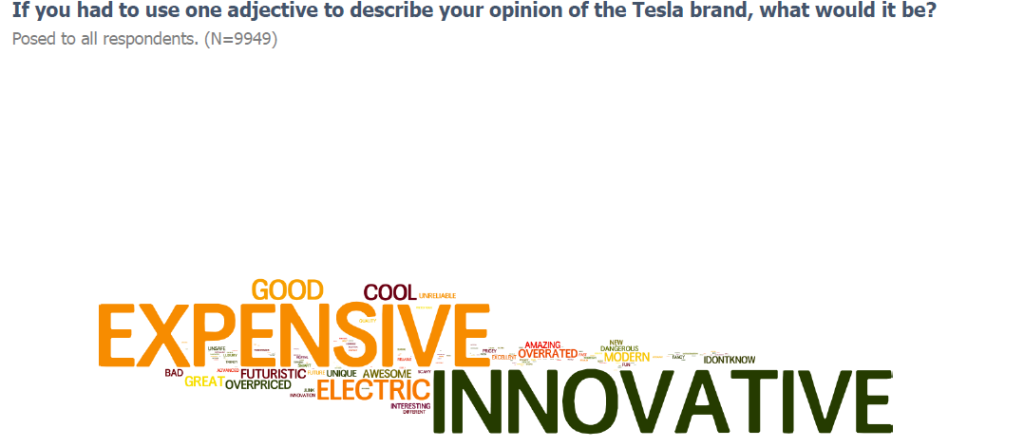
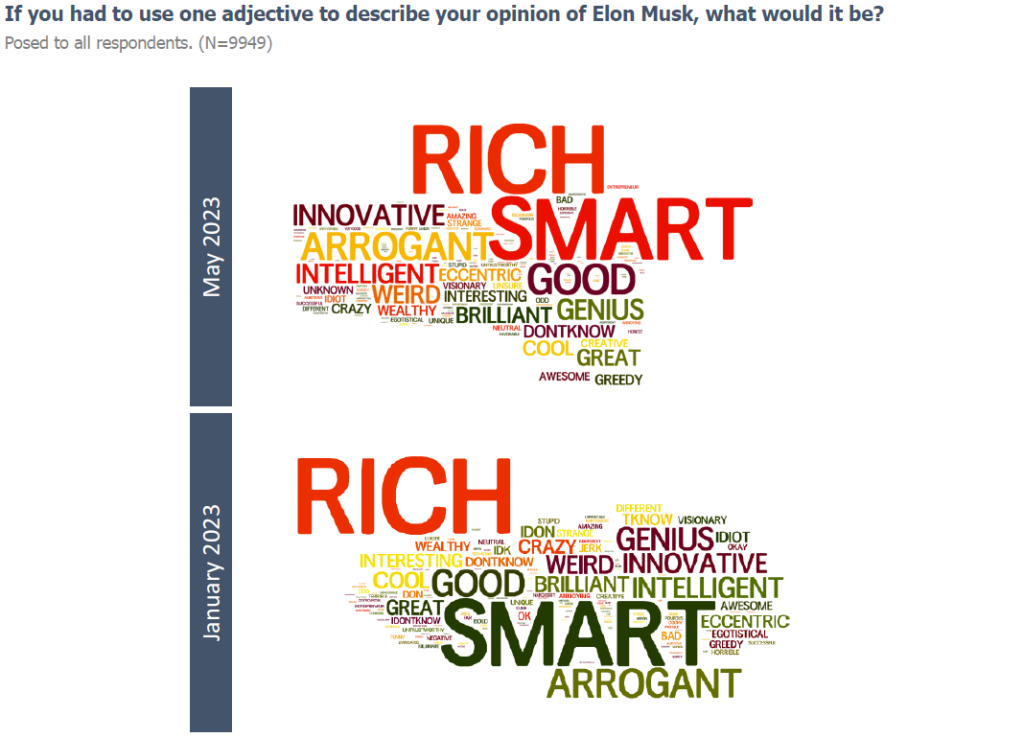
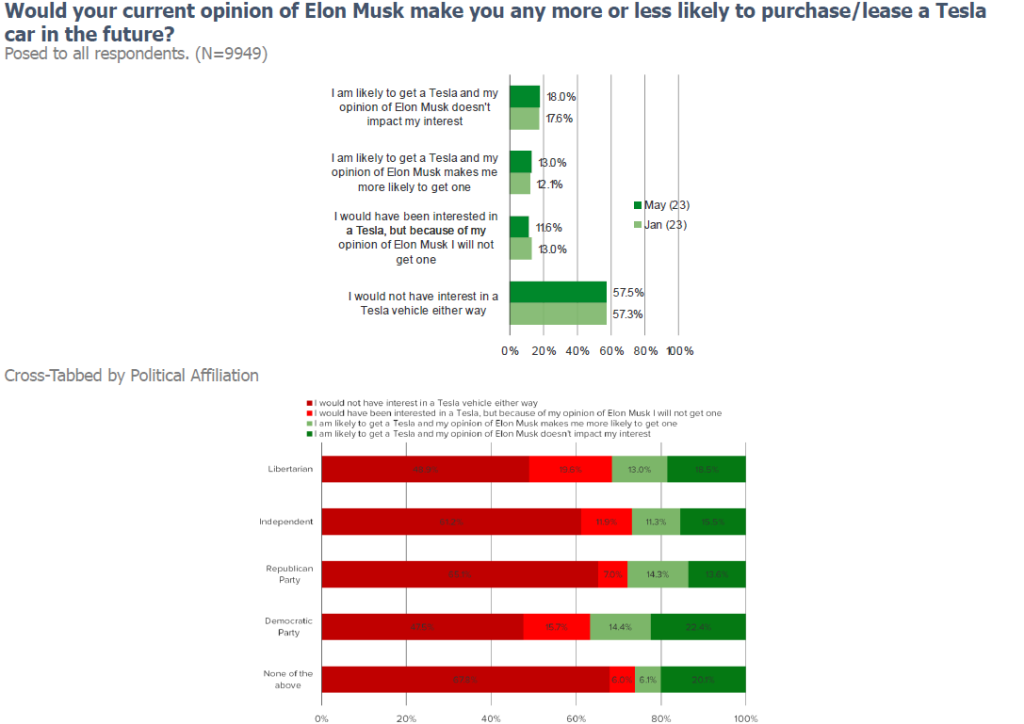
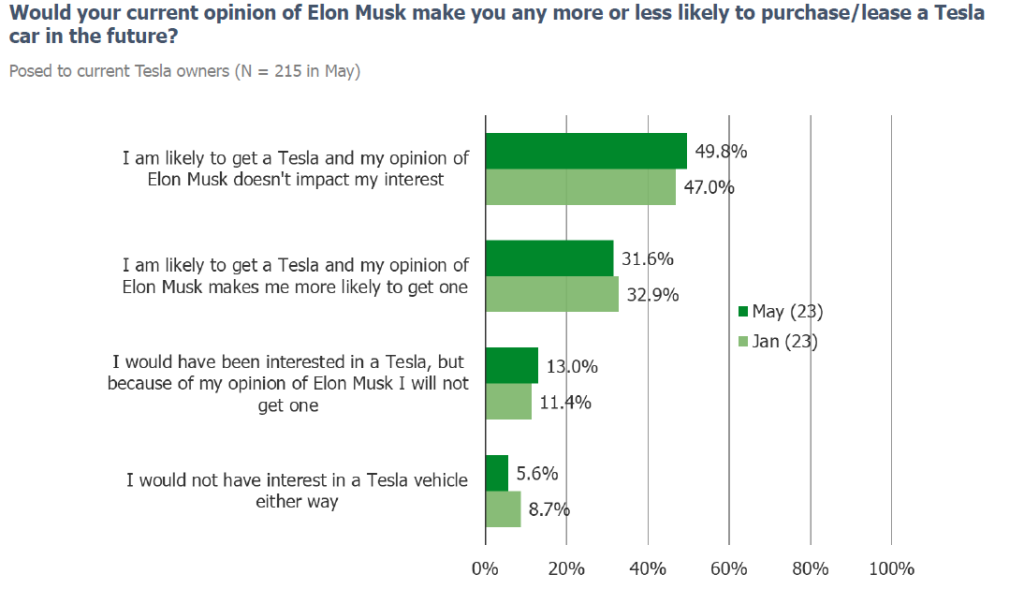
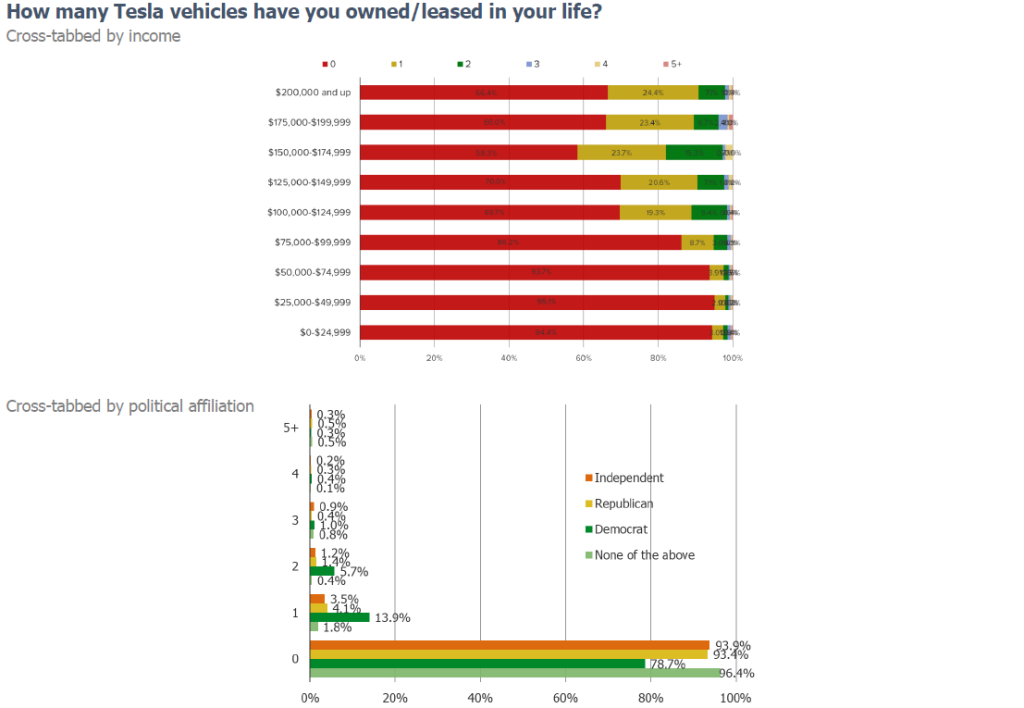
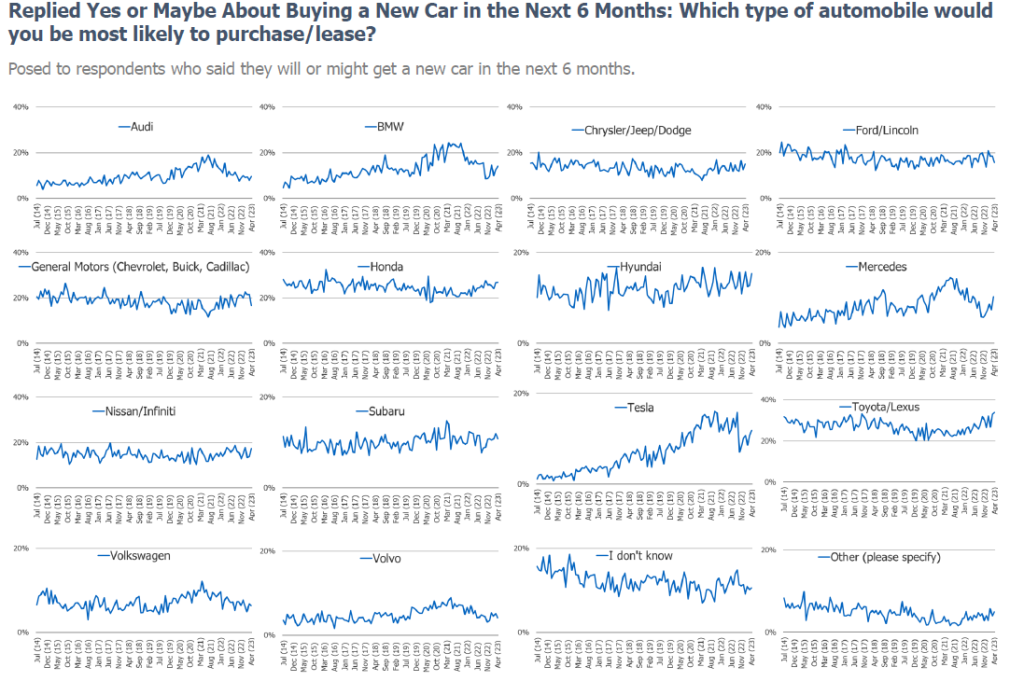
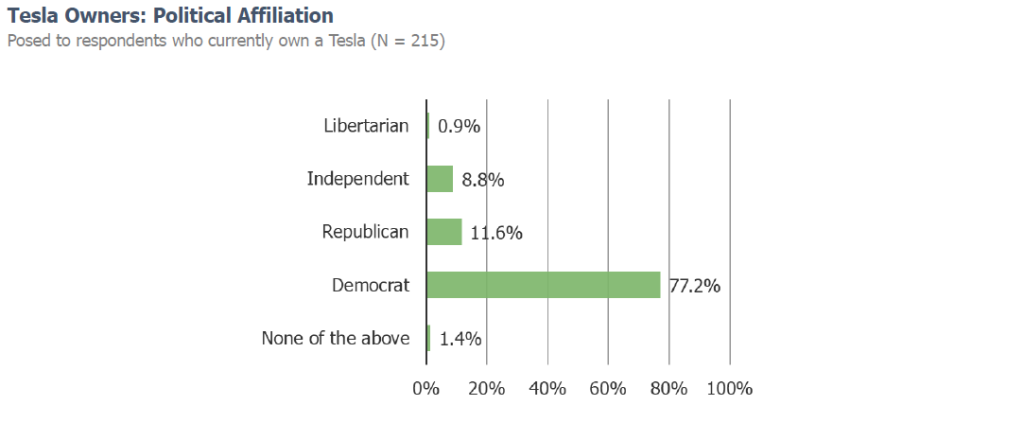
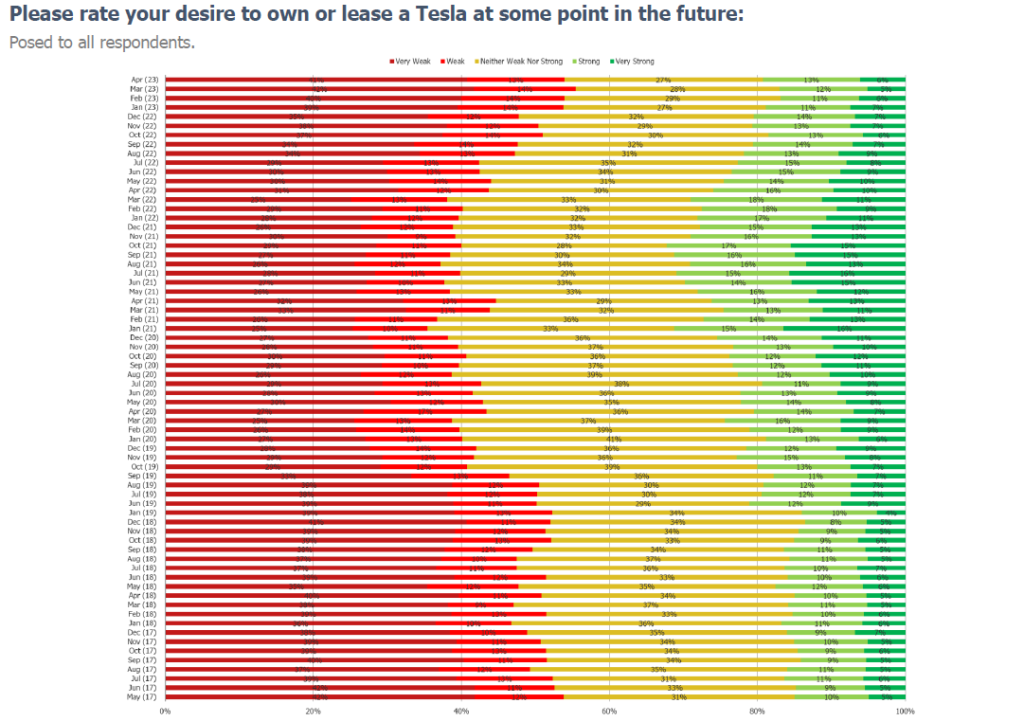
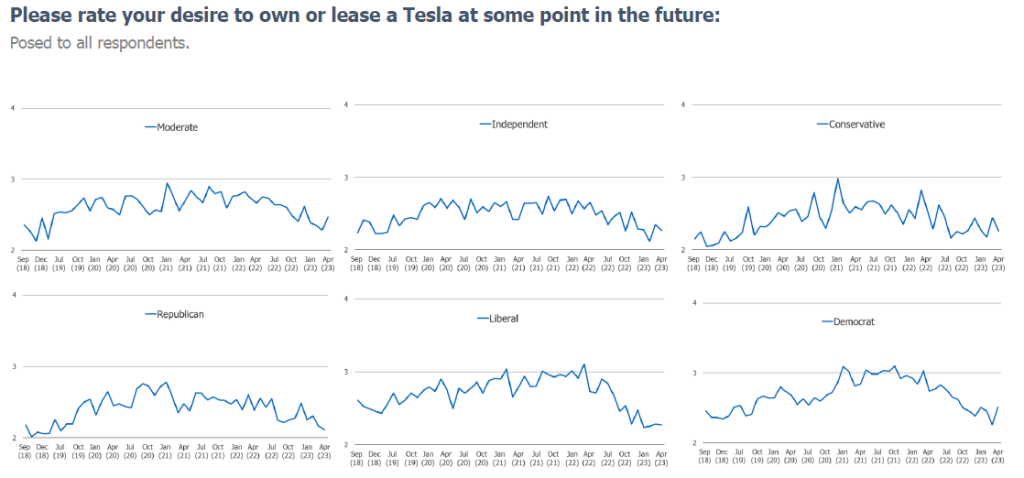
TSLA Brand Health Check (May 2023)
The below charts are from a survey conducted in May 2023. We will be running this same survey with consumers over the next week. Let us know if you might have any interest in the upcoming results!
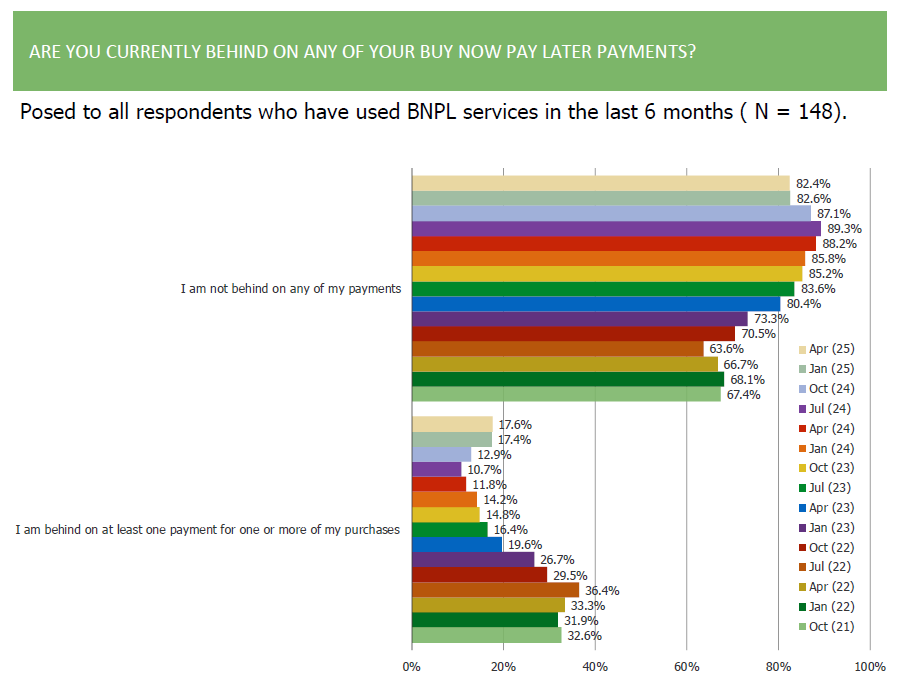
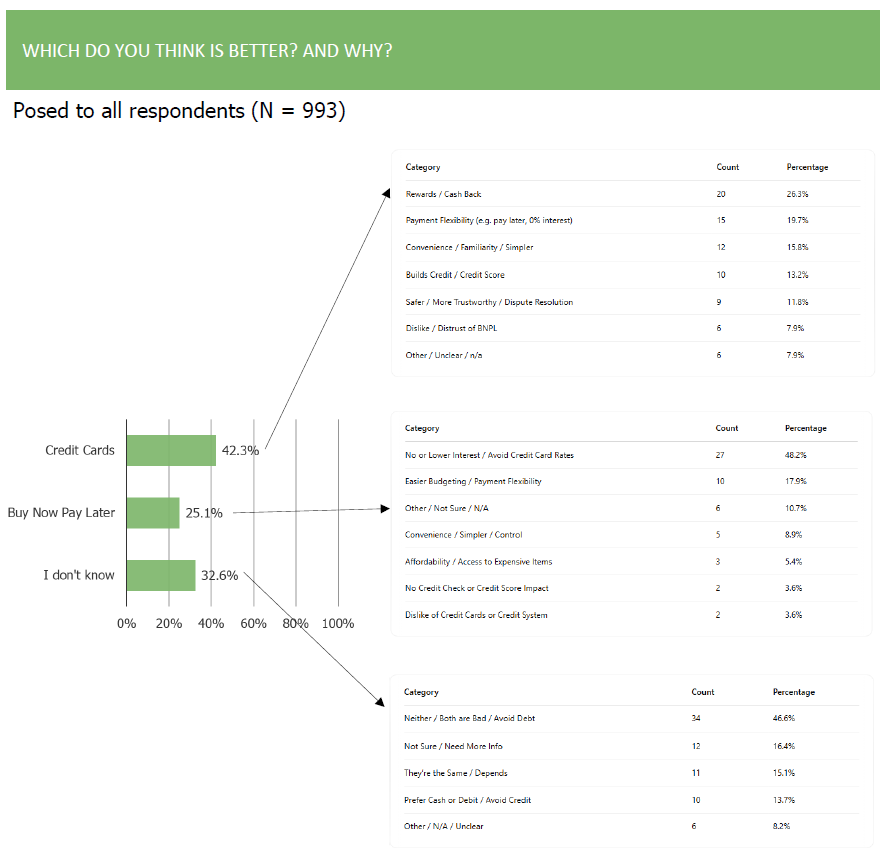
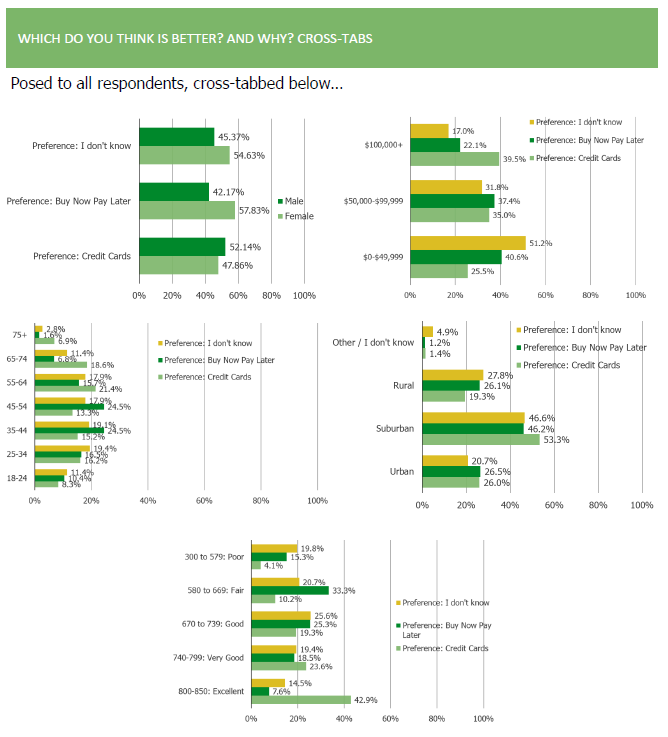
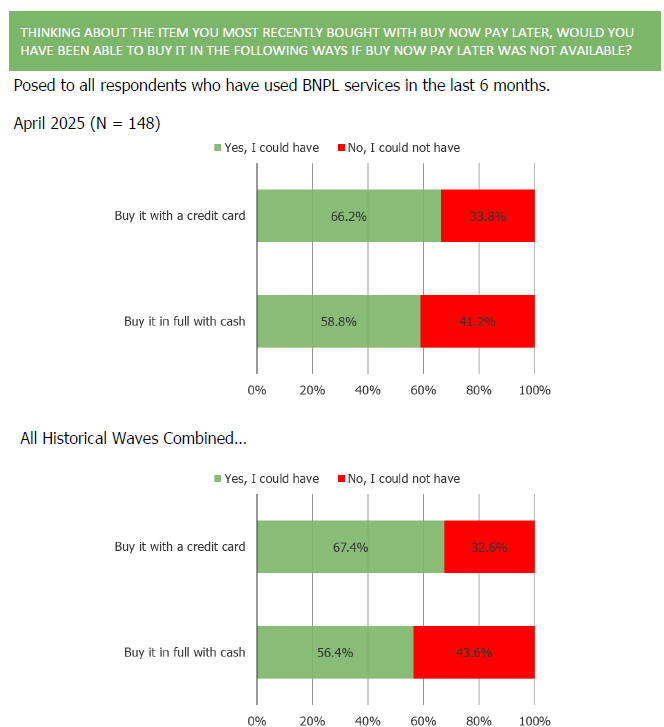
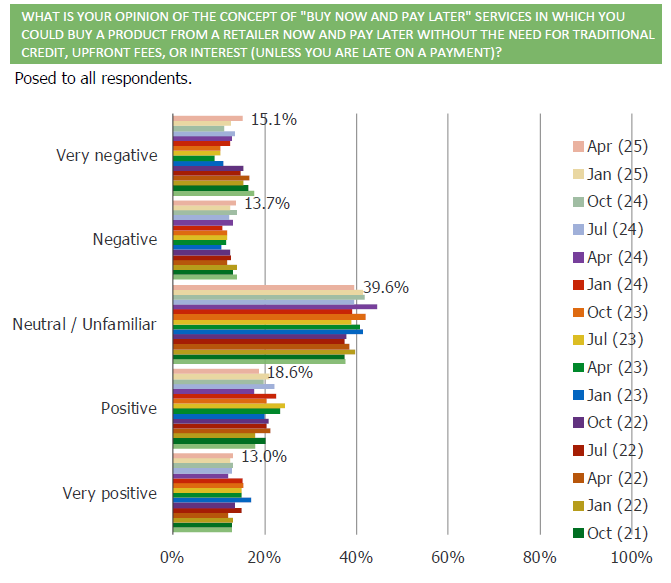
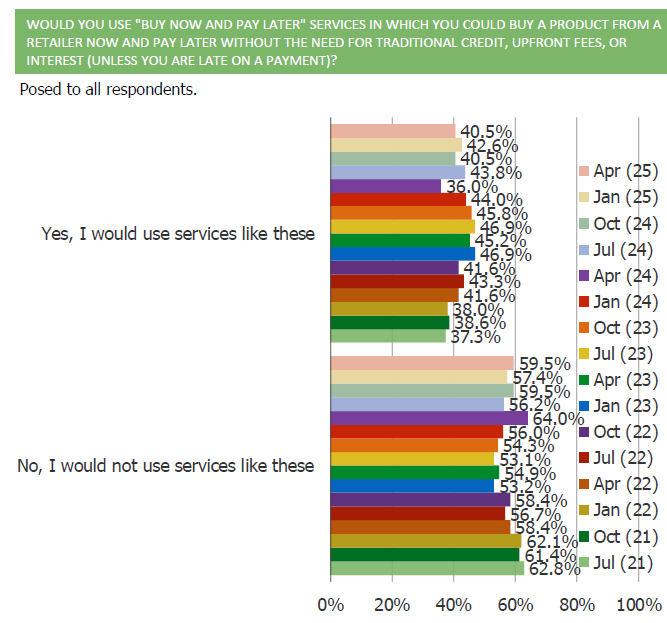
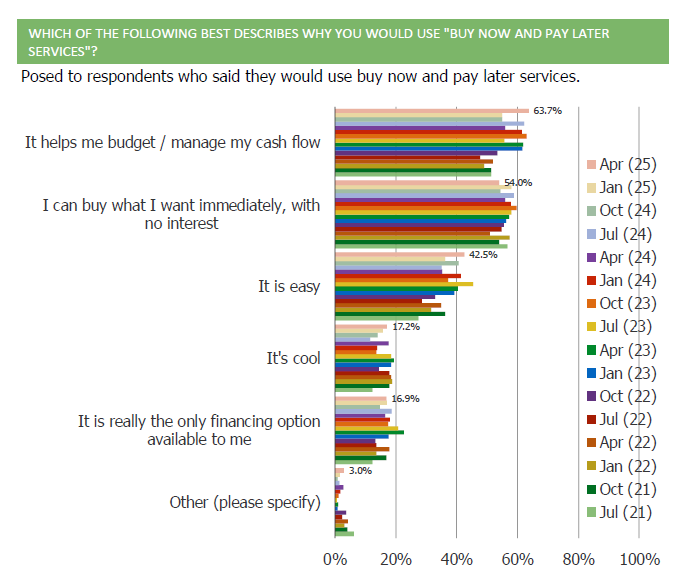
BNPL Survey Report, With History
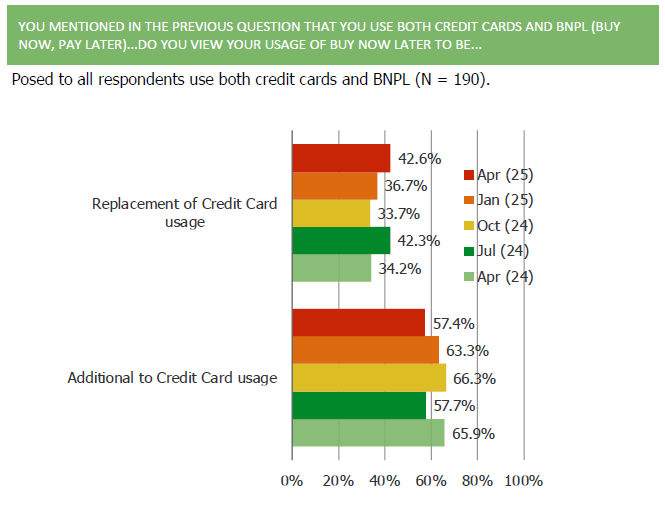
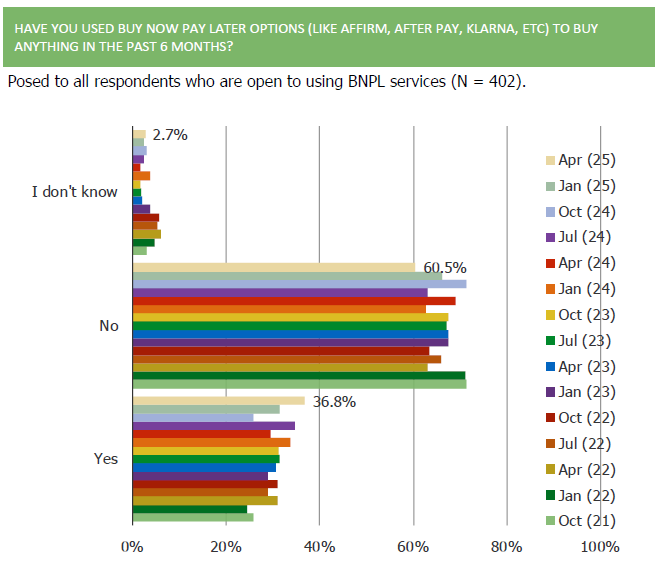
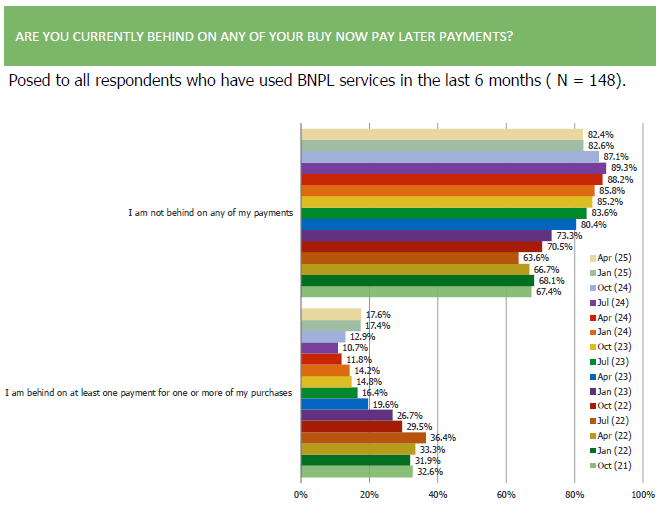
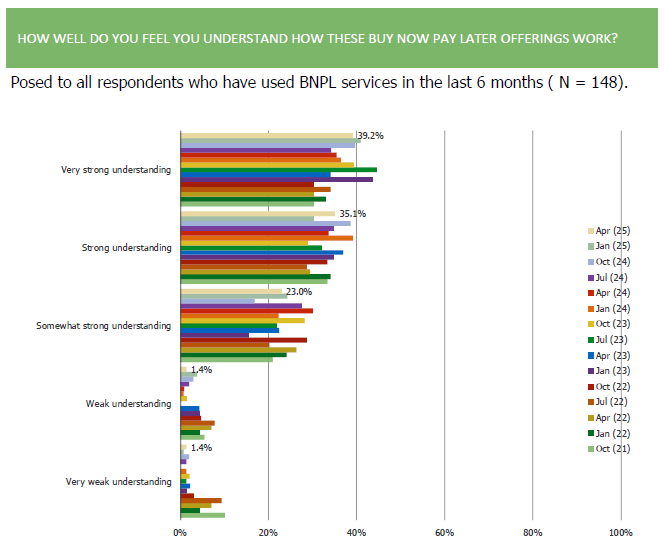
Consumers Are, ON CLOUD, Nine….
Positives:
- Consumers love the brand and opinions are improving.
- Pricing power with consumers.
- High quality customers (over-indexes to more frequent purchasers and brand direct folks).
- Over-indexes demographically to younger and higher income consumers.
- Customer base fees less bad about tariffs and has a much stronger outlook on their finances than the broader population
How would you describe your overall percenption of the ON (ON Cloud) brand today?
Posed to ALL respondents…

Posed to ON CLOUD Customers

How has your perception of ON (ON Cloud) changed over the past 12 months?
Posed to ALL respondents…

Posed to ON Cloud Customers…

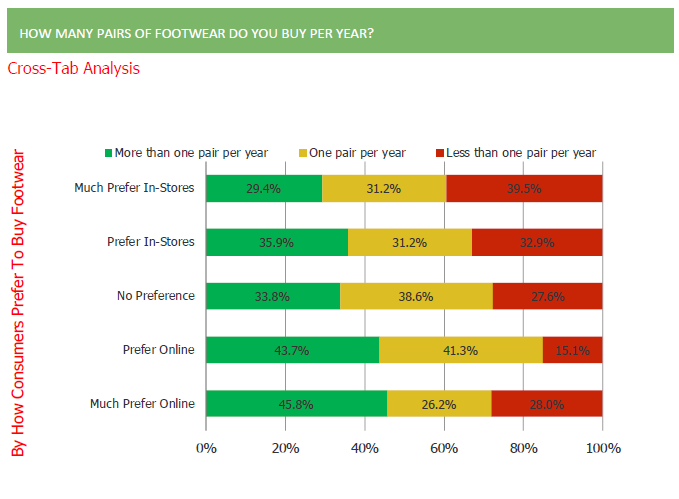
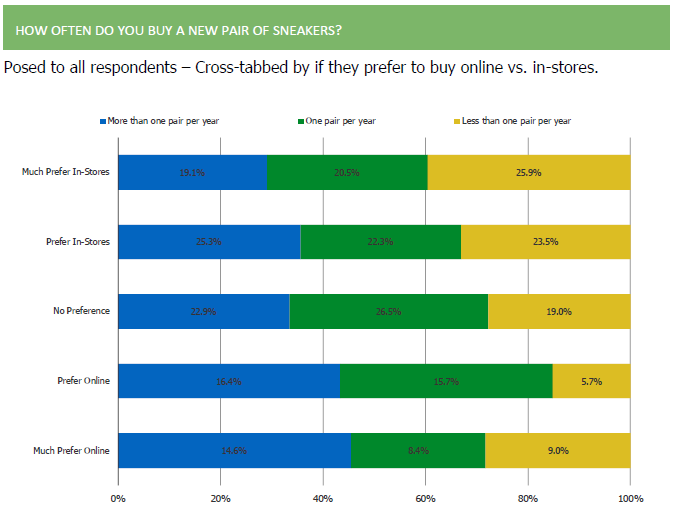
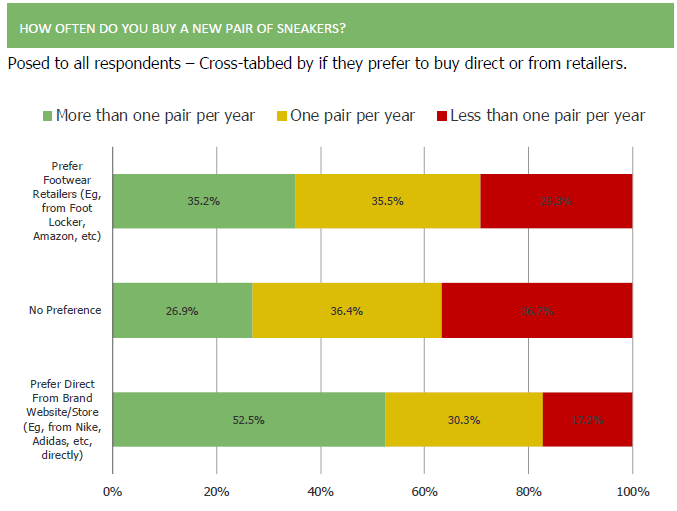
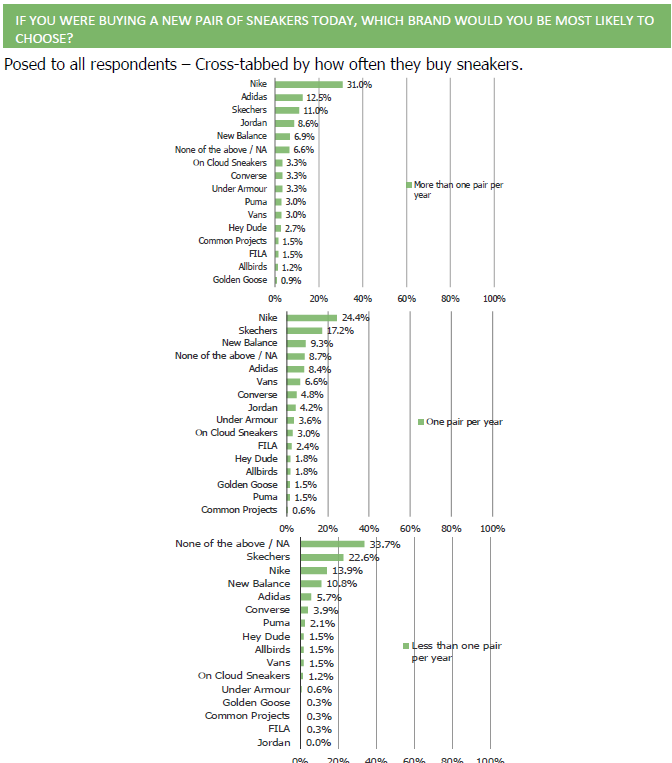
Respondents who prefer to buy sneakers direct from the retailer buy more pairs of shoes per year…

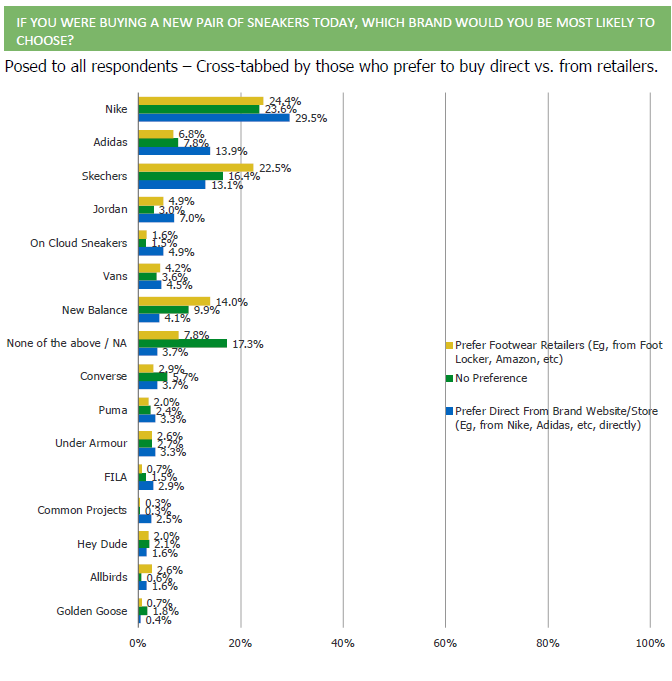
People who prefer to buy directly from the brand significantly over-index to a preference for ON Cloud sneakers… and indication of brand affinity that outstrips their current market penetration.

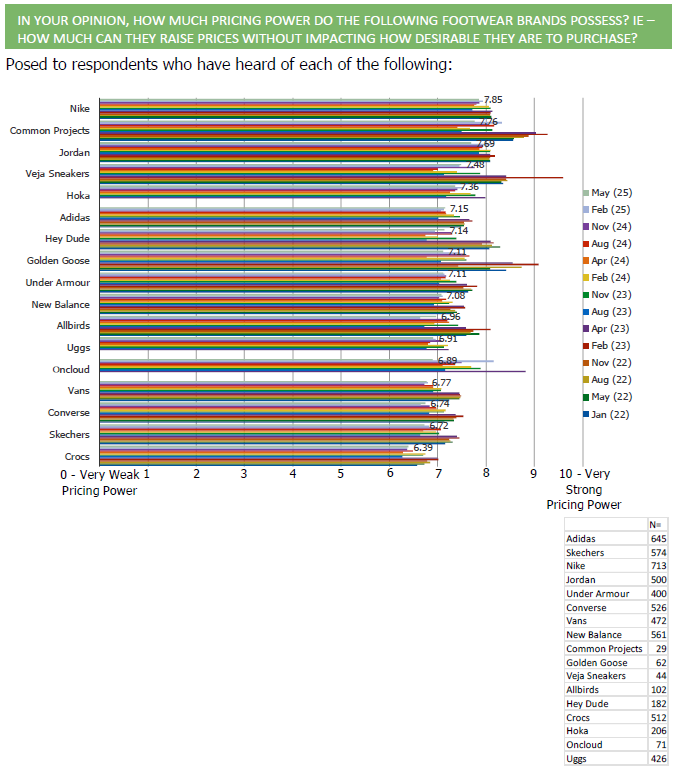
Consumers perceive the brand to have strong pricing power…

Their customer base feels good about their finances and are more sanguine on Tariffs than the broader population.
How would you currently describe your personal financial situation? When we refer to your personal financial situation, we mean factors that directly affect you — such as your income, ability to pay bills or make purchases, savings, job stability, and overall sense of financial security. This is about your own household finances, not the broader economy or what you’re seeing in the news.
Posed to On Cloud Customers

The U.S. has recently announced new tariffs on goods imported from a number of countries. Do you support or oppose these tariffs?
Posed to On Cloud Customers

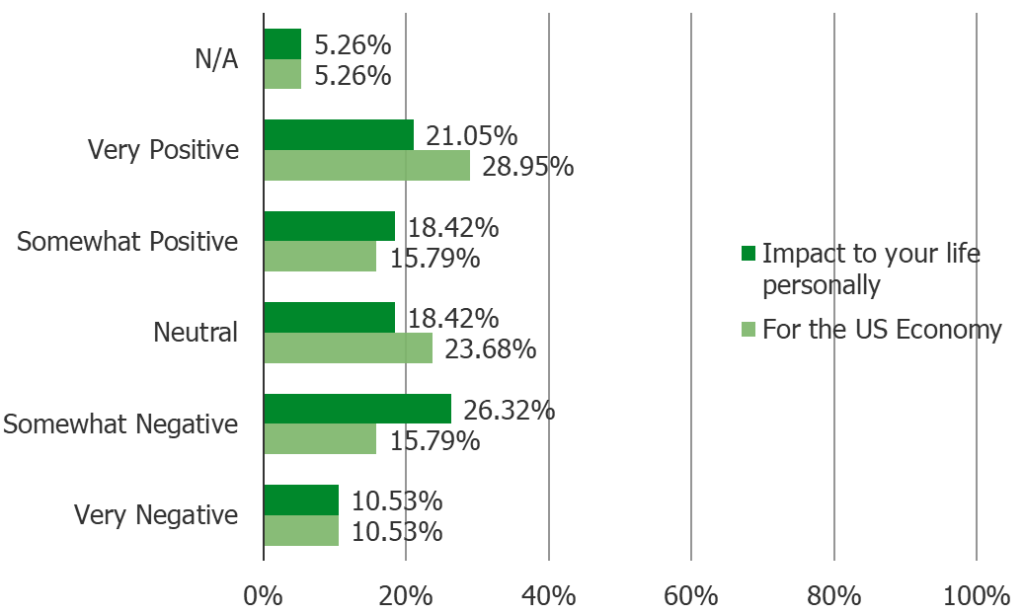
Do you think the impact of tariffs will be…
Posed to On Cloud Customers
Their customer base over-indexes to higher income and younger respondents.
On Cloud Customers Demographics…


Wayfair’s Verified: Un-Wobbling Confidence
Wayfair knows what consumers are thinking: Is this $189 side table actually going to hold anything? Enter the “Verified” badge — their newest attempt to ease furniture anxiety without sending customers a wrench and a therapist. We surveyed 1,000 U.S. consumers and found that a surprising number say a little badge could go a long way. So… is trust just a sticker away?
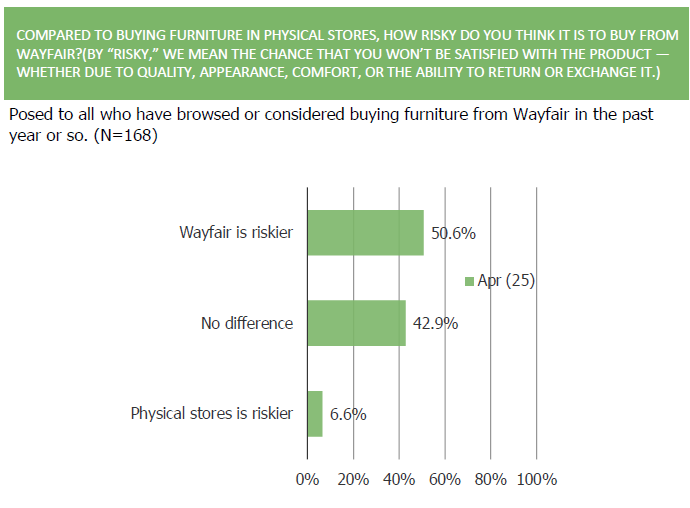
The Problem: From our survey (chart below)… 50.6% of those who have considered buying furniture from Wayfair in the past year said that they perceive Wayfair to be “riskier” than buying from a furniture store in person (42.9% said no difference and 6.6% said physical stores are riskier).
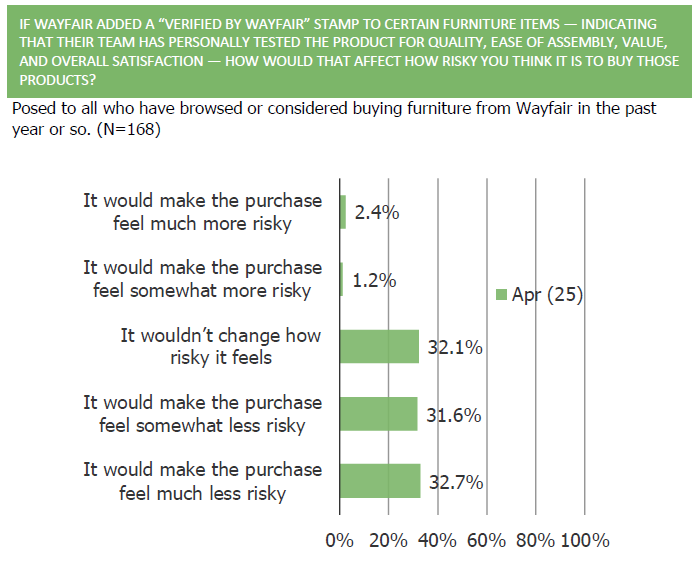
The Solution: Wayfair Verified. Check out our blog post here to see how many of the folks above said that a “Verified by Wayfair” stamp would make the purchase feel less risky.
Charts Below!
X Money vs. Venmo and Zelle
Elon Musk’s X (formerly Twitter) is moving deeper into financial services with the development of X Money, a new payments system in partnership with Visa. This move could challenge established players like Venmo, Zelle, and PayPal, but how do X users actually feel about it?
In our latest mobile payments survey, we asked X users about their trust in X Money, how they might use it, and what features would compel them to switch. The results highlight both opportunities and challenges for Musk’s financial ambitions.
Key Findings:
- 67% of X users would trust X Money the same or more than existing providers like Venmo and Zelle.
- X Users would be most likely to use it for Peer to Peer payments, followed by Bill payments, E-Commerce transactions, and then business payments.
- The top two features that would compel X users to switch from their current payment app to X money are A) Faster Transfers and B) Lower Fees.
- 35.3% of X users said they would adopt X Money and would either reduce or stop using other platforms.
Further Reading:
If you are a client, log-in to view the full report (including more on this topic). If you are not a client and want to learn more contact us ([email protected]).


Realtor Survey | NAR Settlement Fee Changes
The recent National Association of Realtors (NAR) settlement has introduced major changes to how broker commissions are structured, reshaping the landscape for real estate transactions. As these new rules take effect, realtors are adjusting their business models, and investors are eager to understand the financial implications of these shifts.
To gauge the real-world impact, we surveyed a panel of realtors to learn how they are adapting to the new fee structures. The findings reveal clear trends:
Reduced Commissions: 50% of realtors report a decline in their average commission per transaction, while only 9.6% have seen an increase.
Buyer Fee Negotiations Are Rising: 58.3% of realtors say buyers are more frequently negotiating their agent’s commission.
Changing Business Practices: Nearly 65% now require written buyer agreements before working with clients.
Our full report includes in-depth insights and data visualizations on these shifts. If you’re an investor, policymaker, or real estate professional looking to understand the evolving fee dynamics, this report is a must-read.
Contact us ([email protected]) if you would like to see more insights from our deck and/or if you’d like to learn more about our proprietary panel of realtors and surveys.
Survey Excerpt:


(GOOG, META) 61 Expert Network Calls in 5 Minutes
Some color below from our proprietary panel of ad agencies. These are folks who we found using our proprietary research recruiting methodology, not people we surveyed through a consumer panel by job title. That means very high quality responses (zero bots or fake respondents). Why spend hours on the phone with experts when you can absorb their feedback in a matter of minutes?
We will be re-running this ad agencies survey next week along with surveys on the below audiences. Start a trial with us today to check out the upcoming results / our full library.
Other B2B Audiences In Our Panel:
- Travel Agents
- SMB Owners
- Restaurant Owners
- Realtors
- HVAC Managers
- Construction Managers
- Chief Information Officers
- CFOs
- Doctors
- HR Managers
Ad Agencies | Social Media Platforms Color


Ad Agencies | AI Color


(AAPL) iOS 18 Excitement and AI
Below are charts from the 46th volume of our AAPL consumer survey work in the US (we run AAPL surveys in China as well).
AAPL has come into focus as a topic of increasing interest with the buyside recently. Start a free trial with us to see all pages from wave 46 and to follow where this data goes when we run volume 47 in two weeks.
If you are a client, log-in to view the full report.
Takeaways:
- People say they are more excited for iOS 18 than prior updates.
- The share of consumers who plan to choose iOS as their next phone increased and reached a series high in our July wave.
- Consumers in our surveys have been broadly positive toward AI. Adoption has steadily increased with each wave we run and there is a larger cohort who tell us they would potentially refresh hardware if it worked better with AI “depending on what AI can do for them”
- Consumer opinions toward AAPL have improved, especially in recent surveys.
Charts:


(NFLX) Survey Insights | Account Sharing and Ad Supported Tier
NFLX shares are up 50% over the past year. We have been tracking NFLX and peers with quarterly surveys going back to 2013… so we’ve gotten to know the customer pretty well! Below we highlight some findings from our latest survey related to the two issues we are getting asked about the most recently – account sharing, and the ad-supported tier.
Account sharing is down…


An increasing share of subscribers are on the Standard with Ads Plan…

Among non Netflix subscribers, Standard With Ads is the most likely plan to entice them to become customers in the future…

Netflix got the price point right on Standard with Ads, and it is already building pricing power in the tier!

In all facets, Standard with Ads subs say the tier has been better than expected…

Where did Standard with Ads subs come from? A mixture of higher priced plans, non-subscribers, and folks who were accessing someone else’s account…

For more on Netflix start a free trial to our platform to see more data (summary of key topics covered in our survey below)
Netflix Account Sharing and Usage:
- Do you let anyone living outside of your household use your Netflix account?
- How many people who live outside of your household do you let use your Netflix account?
- What is your relation to the person whose Netflix account you access?
- Who pays for the subscription of the Netflix account you use?
- How important is it to you to be able to share your Netflix account with people who live outside of your home?
- Have you had any trouble accessing the person’s Netflix account you typically use?
- Which of the following would you do if Netflix no longer allowed the person whose account you access to share their account with you for free?
Awareness and Opinions on Ad-Supported Tiers:
- Before taking this survey, were you aware that Netflix has an ad-supported tier with commercials?
- Before taking this survey, were you aware that Disney+ has an ad-supported tier with commercials?
- How likely are you to switch your Netflix subscription to Standard with Ads for $6.99 per month in the next month?
- How likely are you to sign up for the following Netflix plans in the next month?
- Which of the following best describes your Disney+ subscription?
- How likely are you to switch your Disney+ subscription to Basic with Ads for $7.99 per month in the next month?
- How likely are you to sign up for the following Disney+ plans in the next month?
Interest in Streaming Content:
- How much interest do you have in watching the following on Netflix?
- If Netflix took over a mall location near you to create experiences based on Netflix shows, how much interest would you have in visiting?
- How much interest would you have in watching live sports streamed on Netflix?
- If Netflix started offering more live sports events, would that impact your likelihood of remaining a Netflix subscriber?
Password Sharing Behavior:
- Do you share a password with someone who lives in your household, or someone who does not live in your household?
- Have you been forced to enter a code to re-authenticate in the Netflix app on any device you use to watch Netflix during the past 6 months?
- When asked to re-authenticate to get into Netflix, what did you do?
Consumer Spending and Subscription Dynamics:
- How many streaming video services do you think is the right number to be paying for at the same time?
- How much do you think is appropriate to spend on streaming video services, in total, per month?
- At what monthly price point would you decide to cancel your Netflix subscription?
- How much do you spend on streaming video services per month?
User Experience with Ad-Supported Plan:
- How does your experience with the Standard with Ads plan compare to your expectations when it comes to various factors?
- Before you signed up for Netflix Standard with Ads, which of the following best describes you?
- Thinking about Netflix’s ad-supported tier, how many commercials per hour would you consider to be reasonable?
Future Subscription Plans and Expectations:
- For how much longer do you expect to be a Netflix subscriber?
- How likely do you think it is that Netflix will increase prices in the next three months?
- In general, how often do you expect Netflix to increase their prices?
Former Subscriber Insights:
- Former Netflix subscribers – why did you cancel?
- When were you most recently forced to re-authenticate to get into Netflix?