Blog
Bespoke Survey Insights
WHY SOME BETTERS CHOSE PREDICTION MARKETS OVER SPORTSBOOKS DURING SUPER BOWL WEEK
If you are a client, log-in to read the full report now. If you are not a client, the full survey report with charts is available off the shelf or as part of our syndicated platform.
In our latest Gambling survey, we asked a targeted question to respondents who participated in Super Bowl betting:
Why did you use prediction markets instead of putting that money through traditional sportsbooks like DraftKings or FanDuel?
The Super Bowl provided an early, high-engagement test case for recently launched prediction products from DraftKings, FanDuel, and Robinhood, making it a natural moment to ask this question.
The responses reveal a few clear — and in some cases surprising — themes.
Value Comes First
- Among Super Bowl bettors who chose prediction markets, economic value was the dominant reason.
- Mentions of better odds, better payouts, or simply “more value” appeared more frequently than any other explanation. For these respondents, prediction markets weren’t about entertainment or experimentation — they were a deliberate choice based on perceived economics during a high-profile betting event.
Simplicity and Clarity Matter
- After value, ease and clarity emerged as important secondary drivers.
- Some respondents described prediction markets as: a) Easier to understand, b) More straightforward in how outcomes resolve, and c) Less complex than navigating spreads, parlays, or other sportsbook bet types.
- In the context of the Super Bowl, this suggests that lower-friction decision-making resonates with a subset of bettors.
Trust and Familiarity Play a Role
- Trust and comfort also appeared in responses, particularly where prediction products were associated with familiar brands or platforms.
- Brand recognition and perceived legitimacy helped reduce friction, making it easier for respondents to allocate some Super Bowl betting dollars outside of traditional sportsbook apps.
Legality Was an Edge Case, Not a Core Driver
- We also looked closely for mentions of legality — the idea that bettors chose prediction markets because sports betting is not legal in their state.
- While this did come up in a small number of responses, it was far less common than expected.
- Instead, legality appeared as an edge use case, well behind value, simplicity, and trust. The data suggests that prediction markets are not primarily being used as a workaround during the Super Bowl, but rather as a selective alternative where bettors believe the structure works in their favor.
How Prediction Platforms Showed Up in the Data
- DraftKings Predictions & FanDuel Predicts: Performed better than expected across awareness, trust, and recommendation, benefiting from brand familiarity and sportsbook adjacency.
- Robinhood: Stands out on familiarity and comfort, with awareness exceeding several standalone prediction platforms despite limited differentiation.
- Kalshi: Skews toward users focused on simplicity and clear outcomes rather than entertainment.
- Polymarket: Appeals more to users who value market structure and tradability, with narrower but more deliberate usage.
Five Things To Like About Netflix…
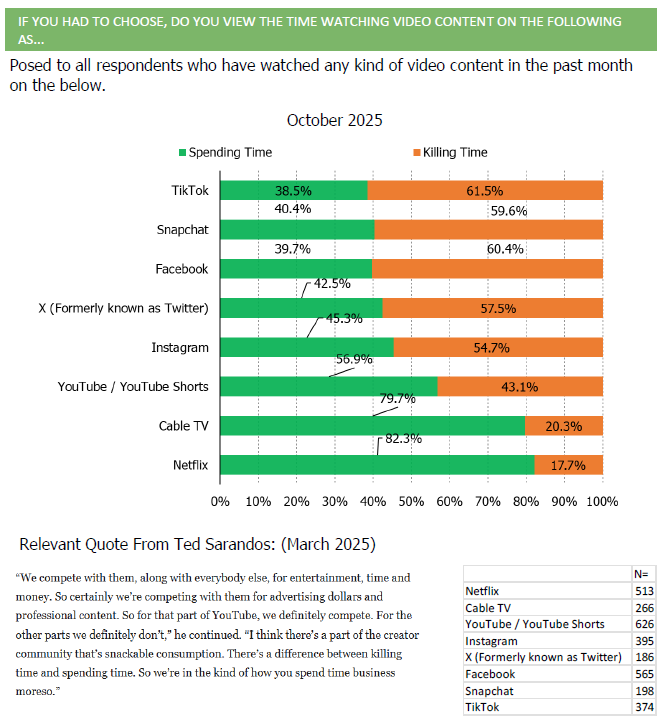
- Viewed the most as “spending time” as opposed to killing time.
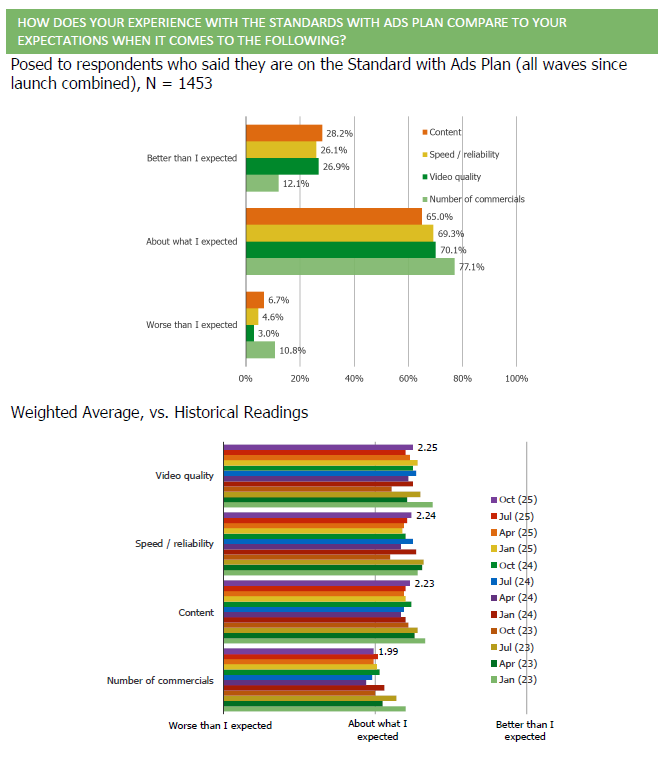
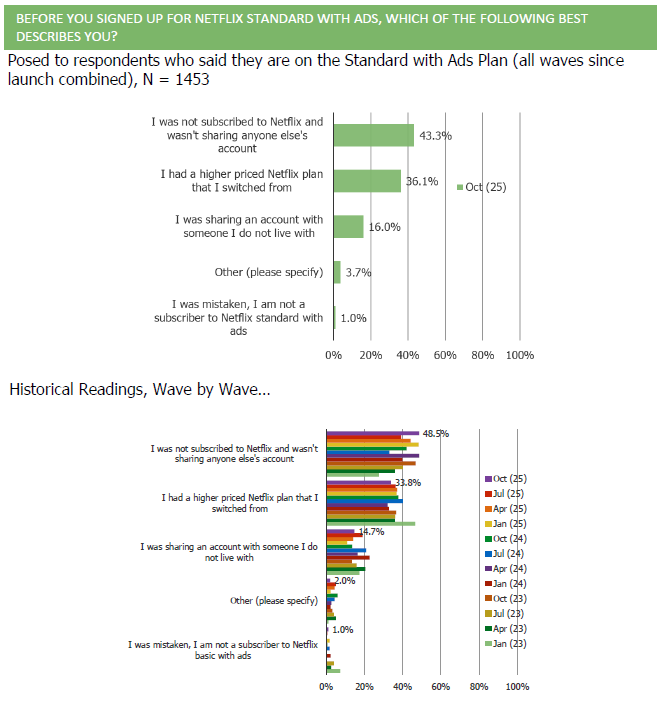
- Positive feedback from SWA subs.
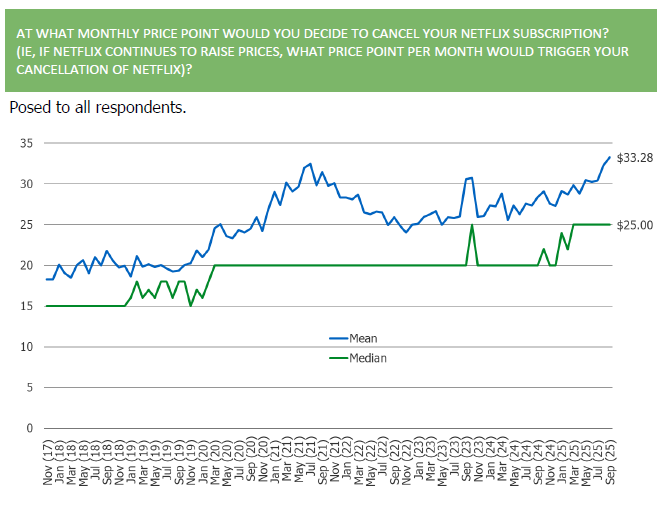
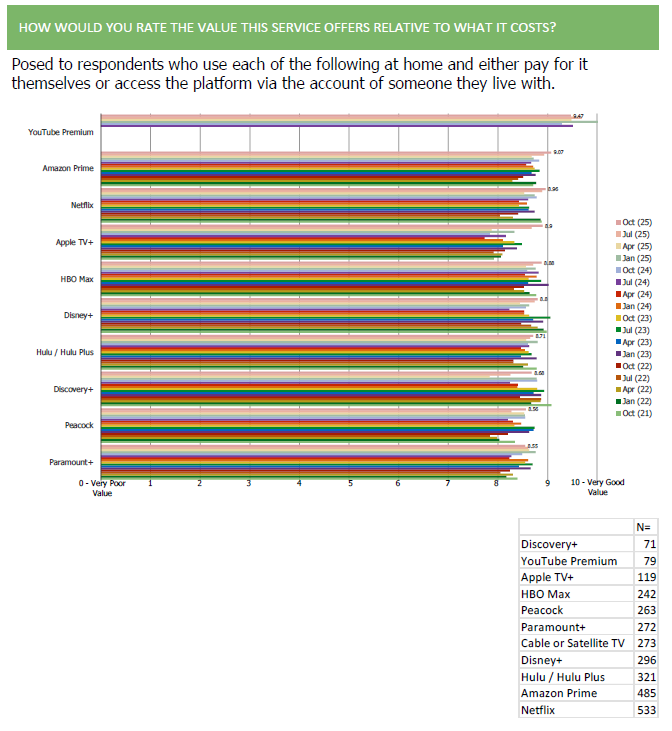
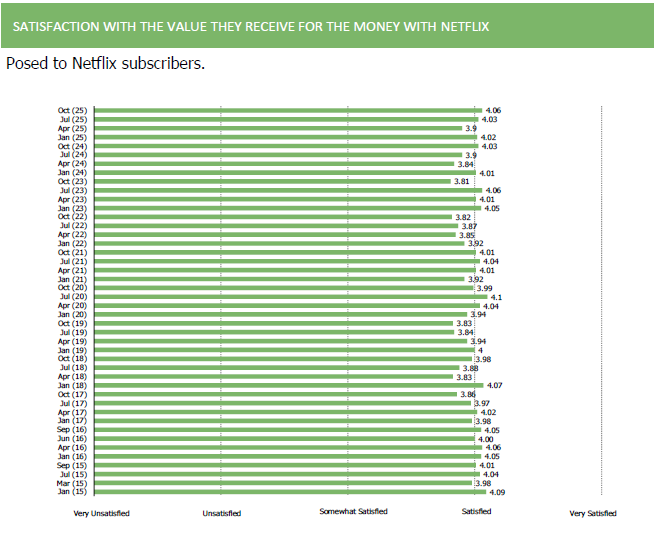
- Strong pricing power that is only getting stronger. Sentiment toward value has improved throughout increases.
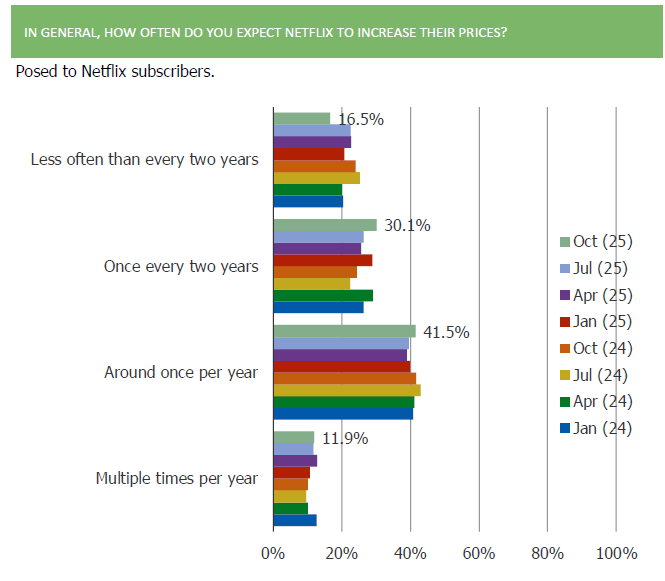
- Churn considerations remain in check; trained customers to “excpect” price increases.
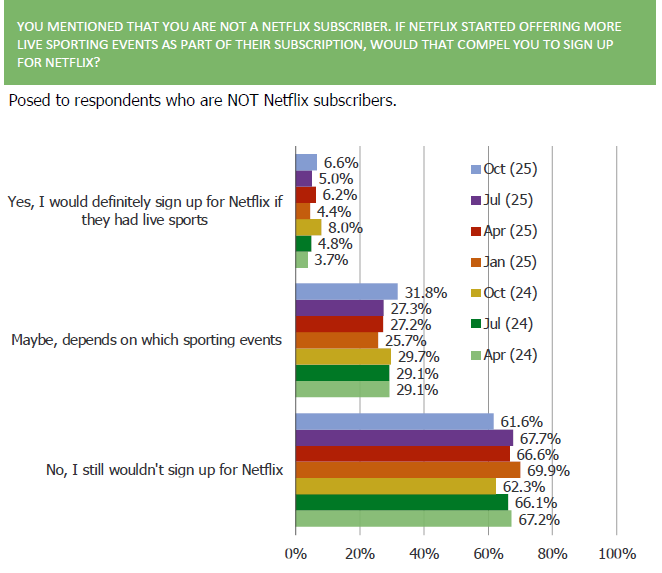
- Engagement is strong and improving, and interest in live sports is increasing.
Some Data From Our Latest Survey (Volume 50!)…
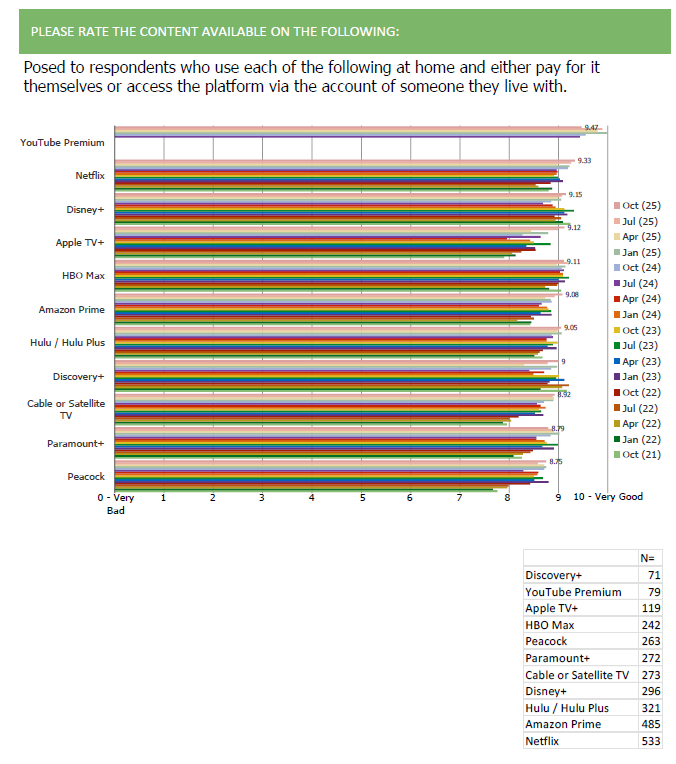
Consumers are most likely to view Netflix as “spending time” not “killing time”.
Though SWA momentum growth in terms of customer mix has moderated in recent quarters, feedback is broadly positive in terms of customer satisfaction and it has been a source for acquiring new users.
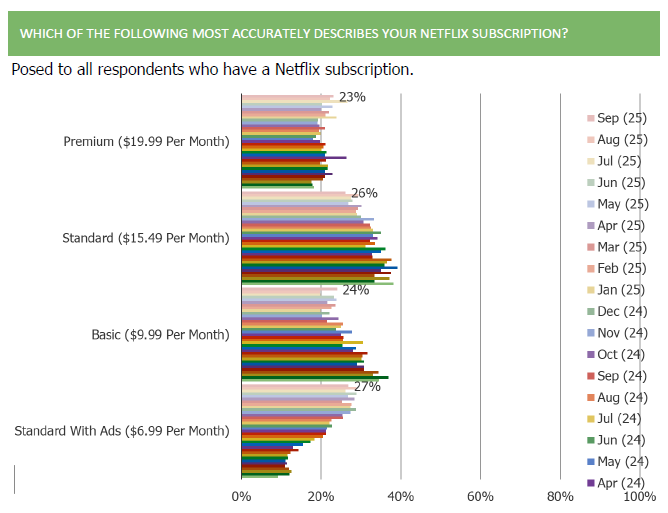
Netflix has strong pricing power, which has only increased over time. The price for SWA is viewed as a steal. Importantly, pricing / value satisfaction has held up extremely well throughout all the most recent price increases. And on top of that, they have now conditioned customers to EXPECT price increases (price increases not being a surprise helps with reactions to those price increases)
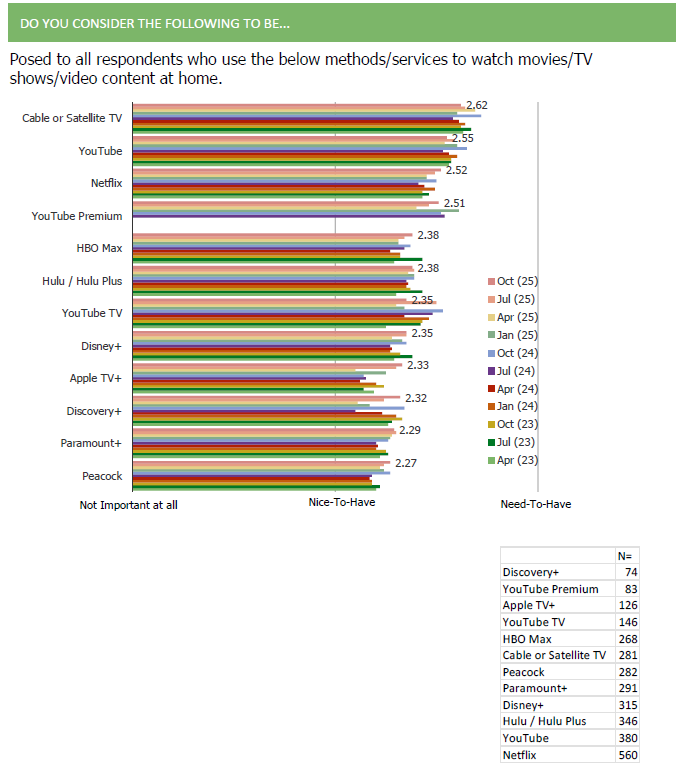
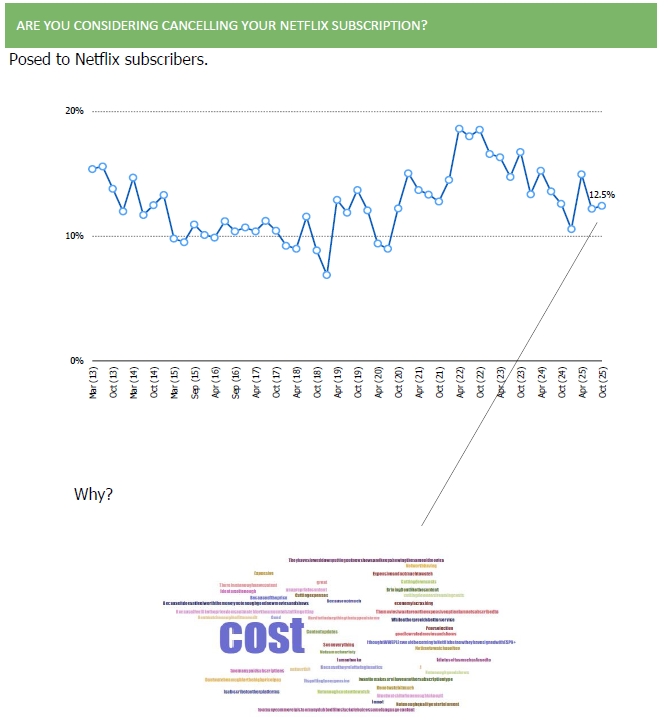
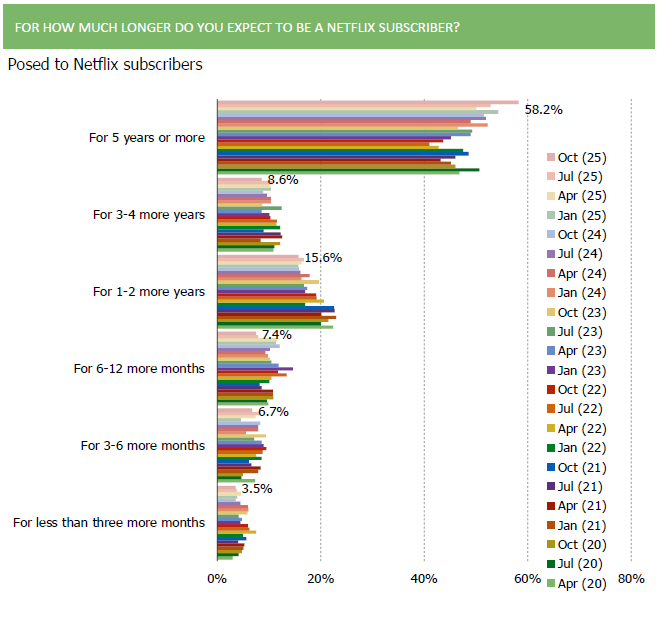
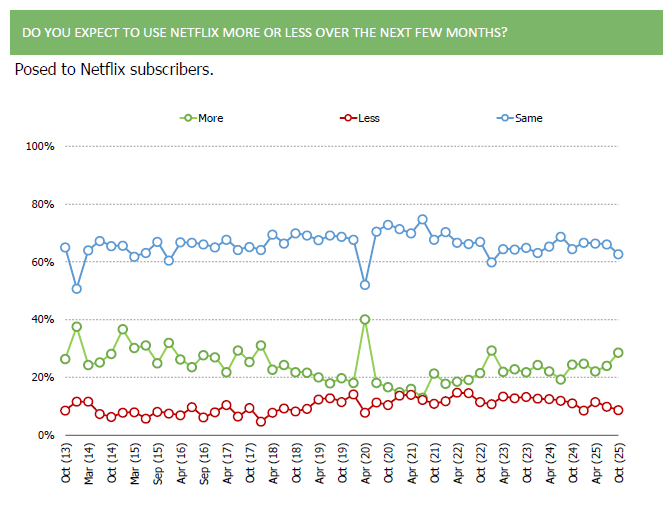
Netflix is among the most likely to be viewed as a “need to have”. An increasing majority of subscribers expect to be subscribers for another 5 years or more. The share of respondents who are considering churning remains well below series highs. The data on this front was not impacted by calls over the past 30 days to “boycott” Netflix.
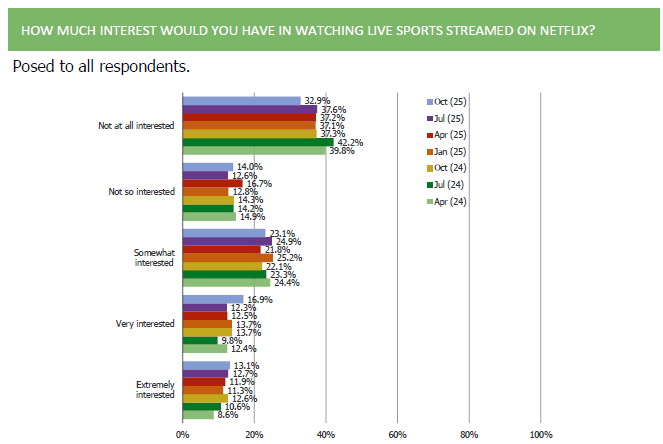
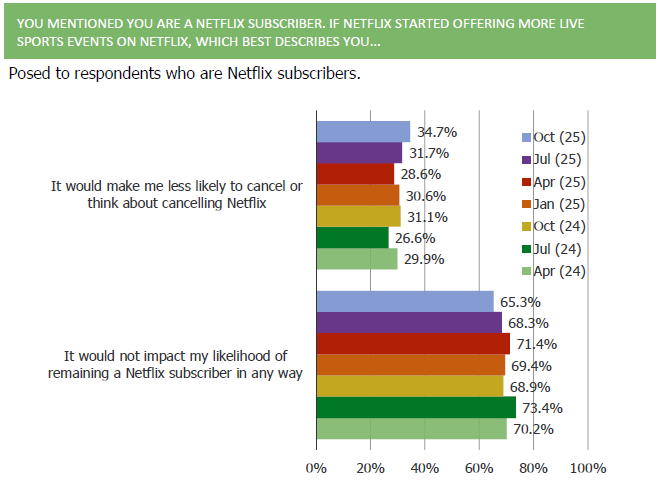
Engagement with Netflix is strong and subscribers expect that to continue. Feedback around content is strong in general, and sentiment toward sports on Netflix remains constructive (there is increasing interest there among subscribers and non-subscribers).
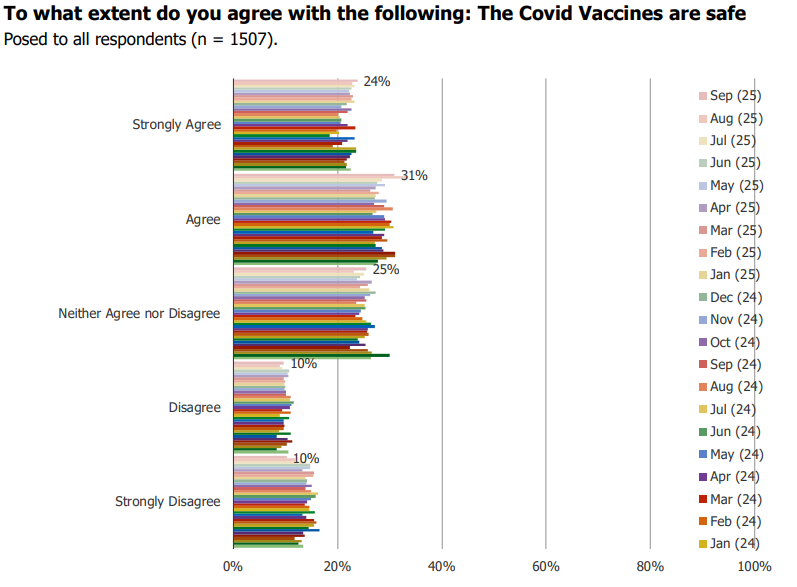
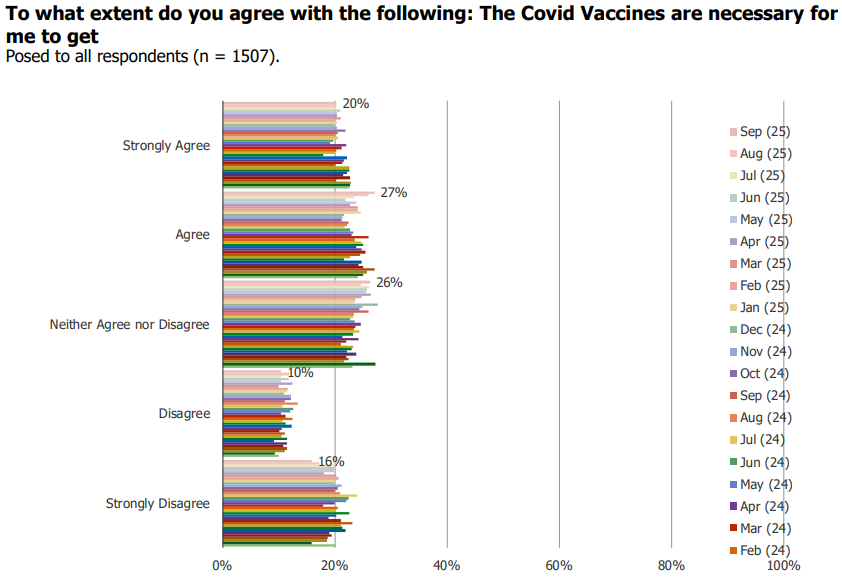
Consumer Attitudes Towards Covid Vaccines
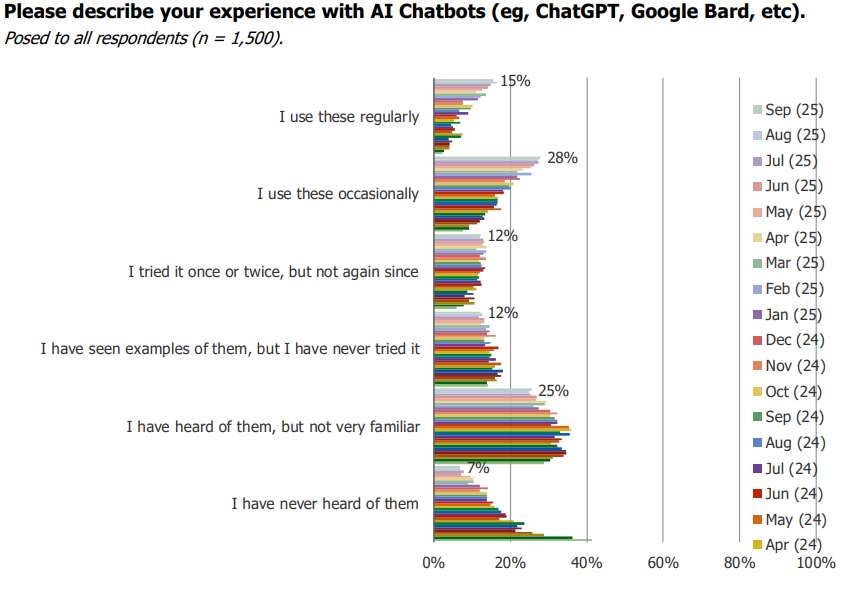
Consumer Adoption of AI Chatbots
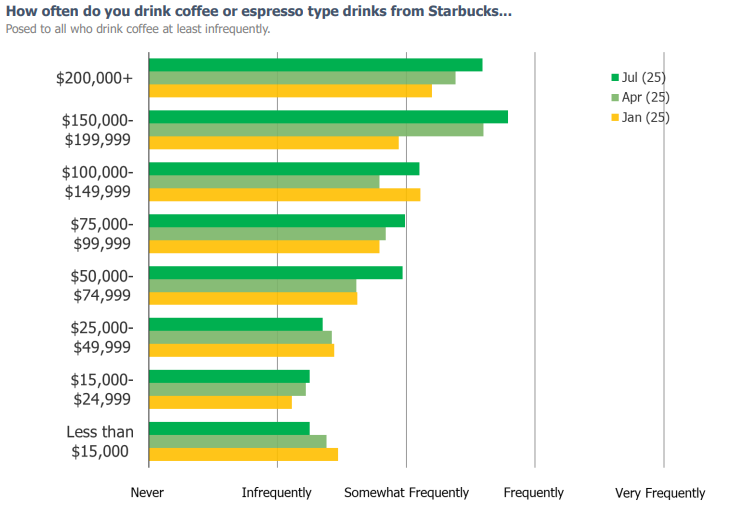
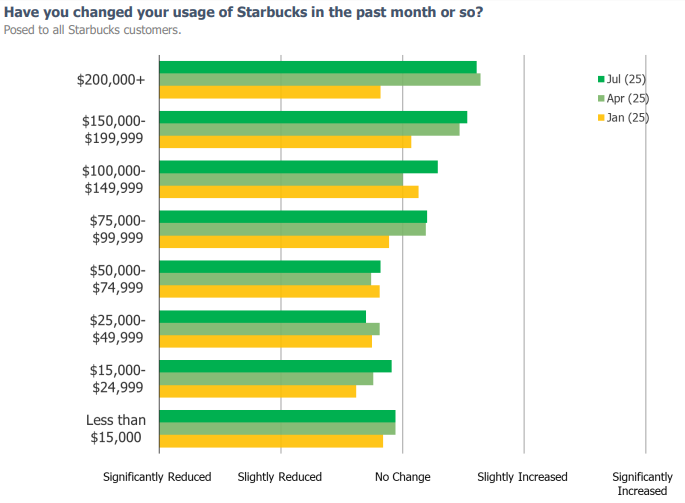
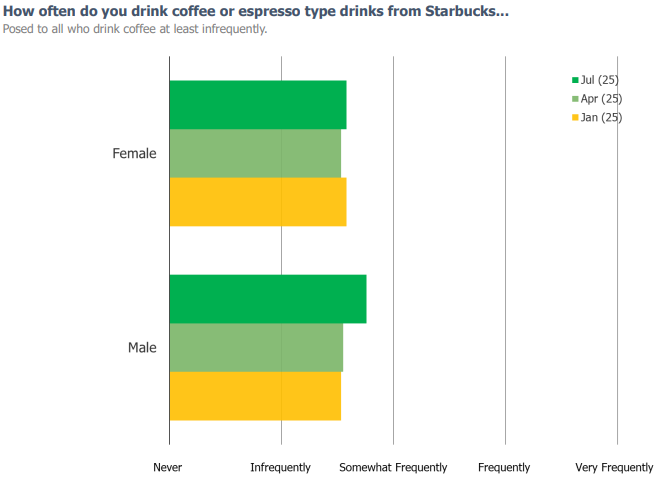
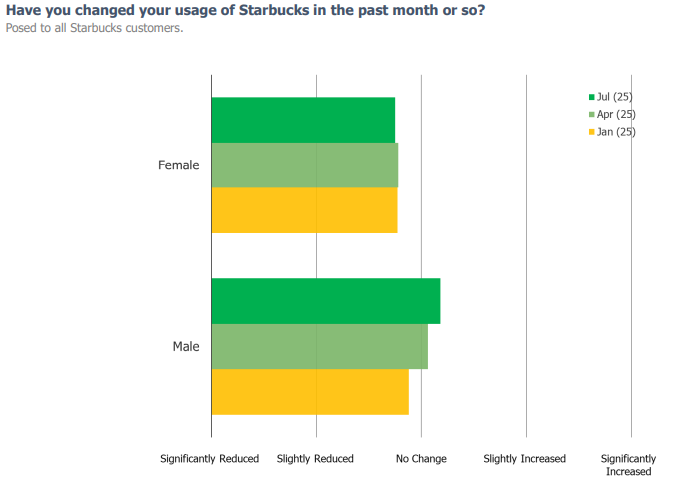
Recent Starbucks Trends – Gender and Income Analysis
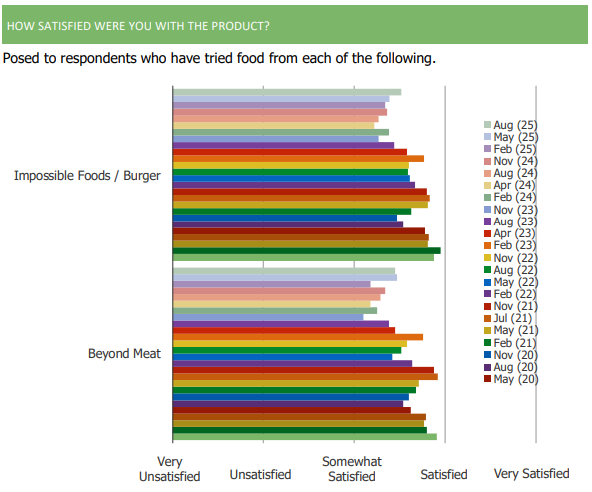
Beyond Meat Product Satisfaction
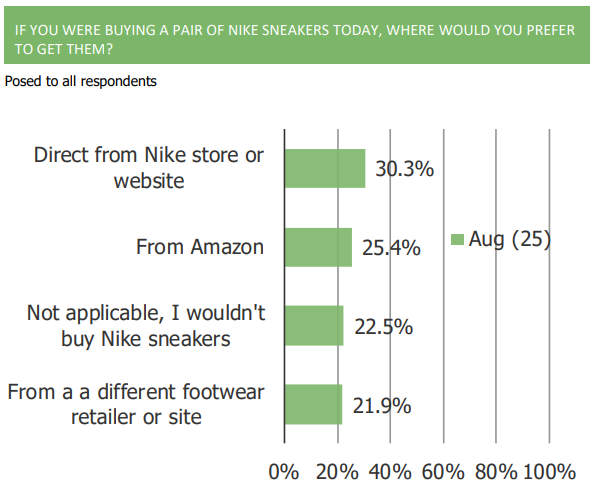
Nike On Amazon
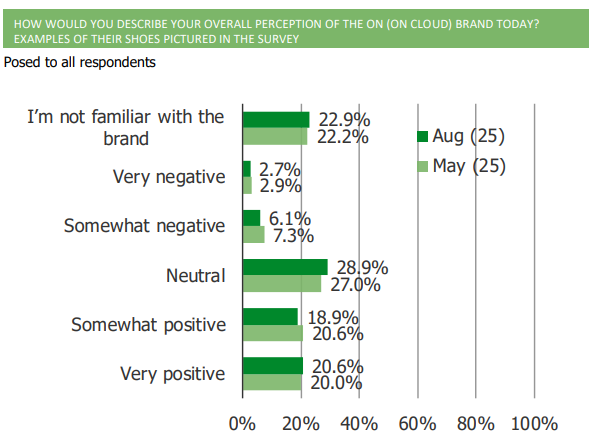
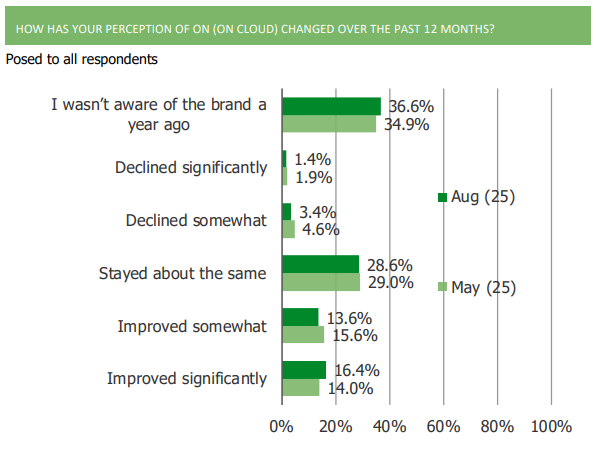
On (On Cloud) Brand Views
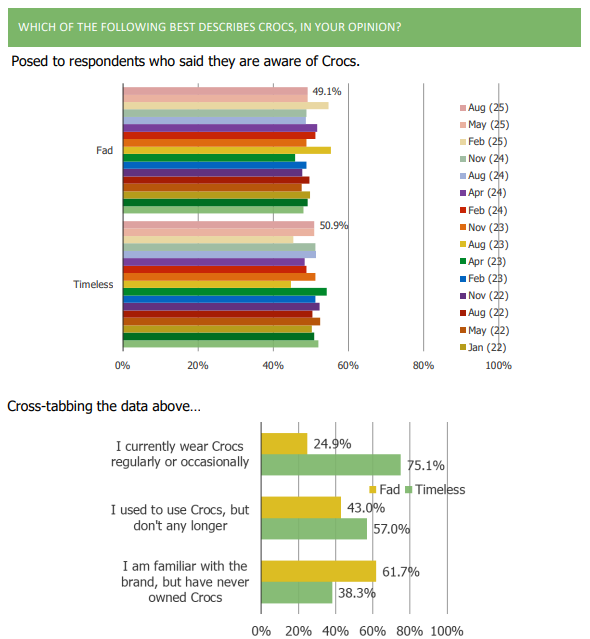
Crocs: Fad or Not A Fad?
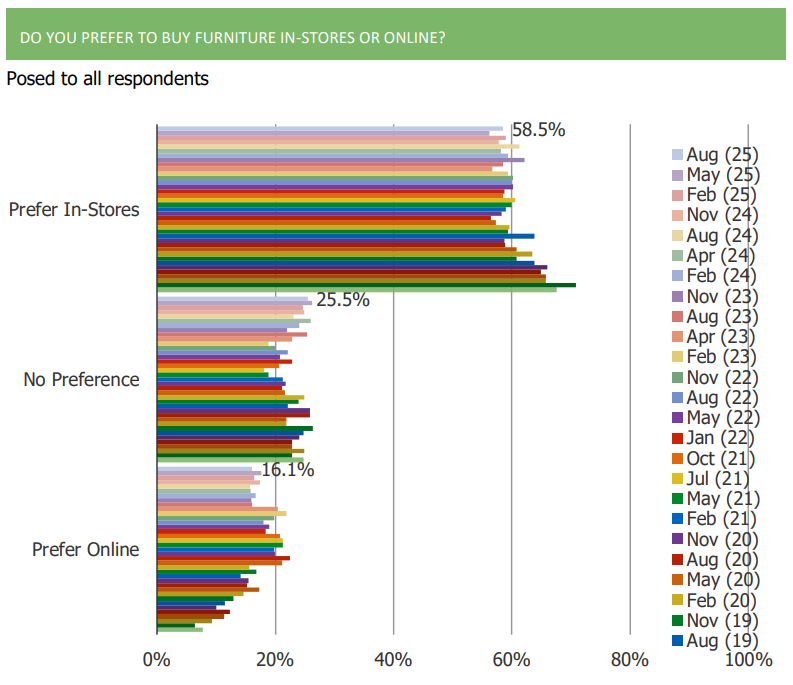
Online vs. In-Store Furniture Purchases
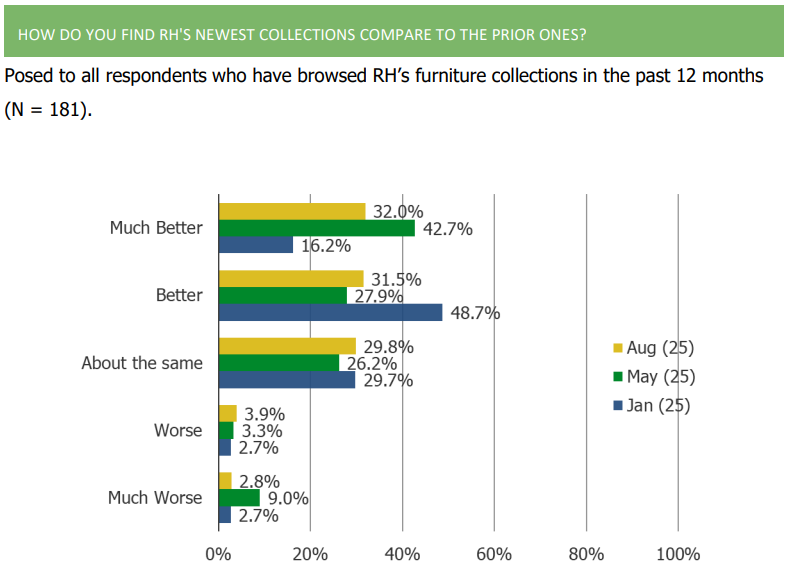
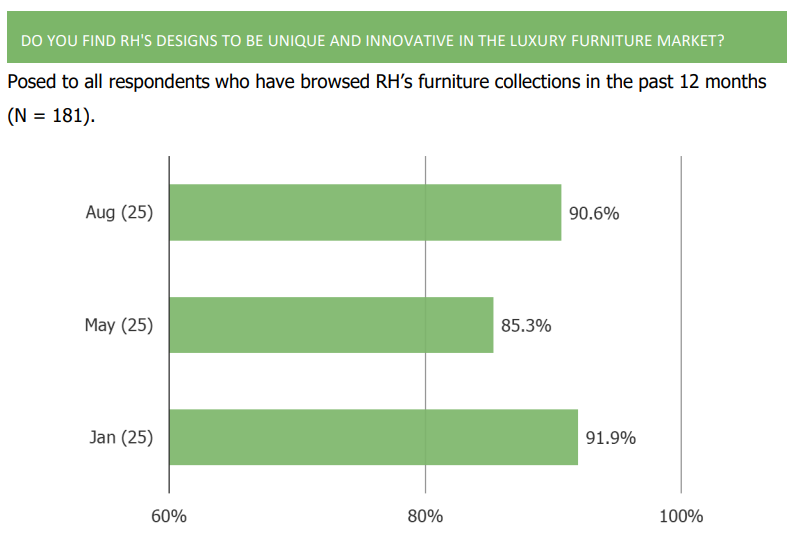
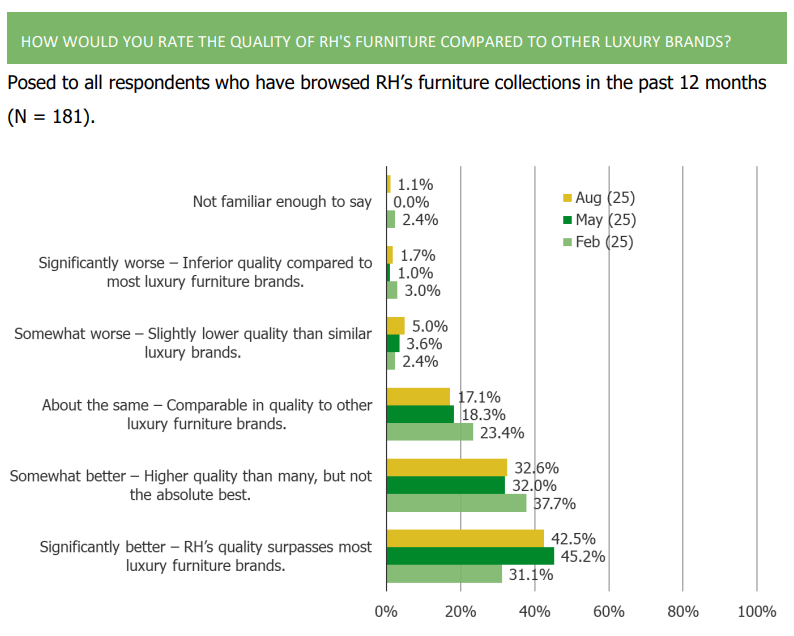
Restoration Hardware Consumer Perceptions
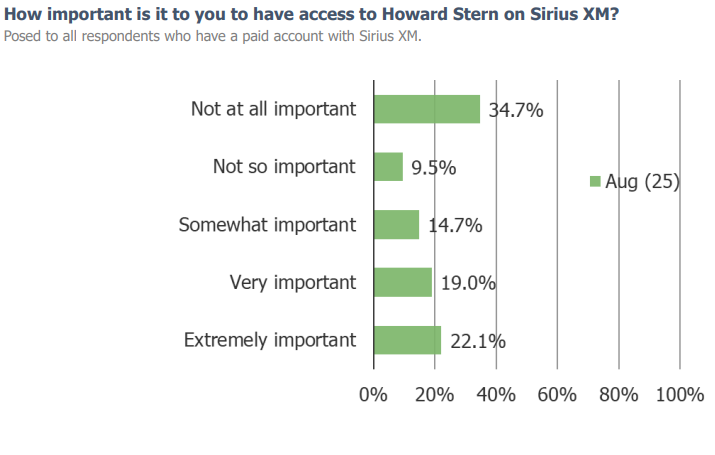
Importance of Howard Stern to Sirius XM