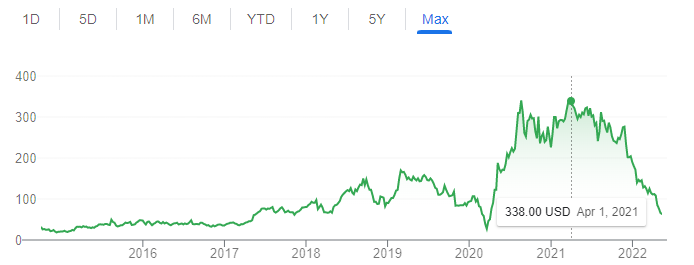
Sharing below an example of a time our survey data added value for clients. For the purposes of this post, we are highlighting data/takeaways we highlighted one year ago when Wayfair was at all-time highs and show charts/KPIs that were helpful based on feedback we’ve received.
Survey Data From Report One Year Ago: April 2021
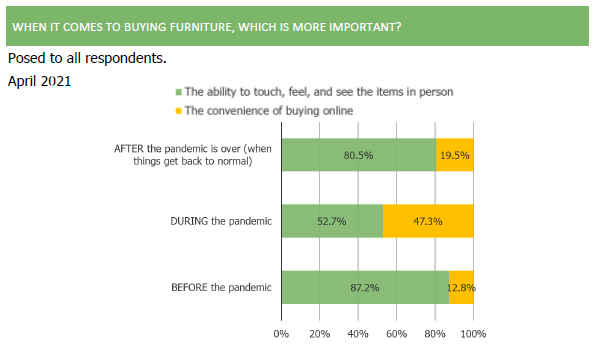
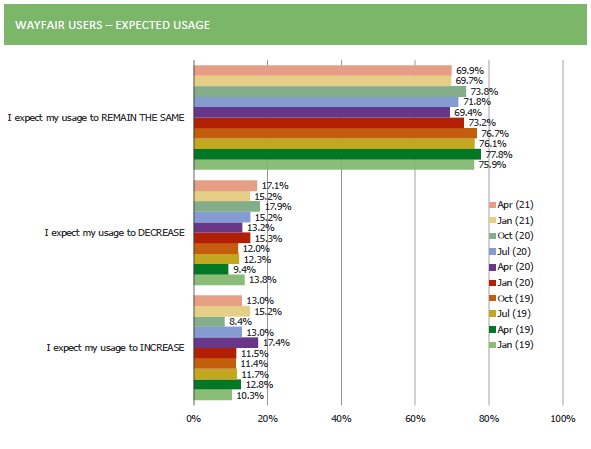
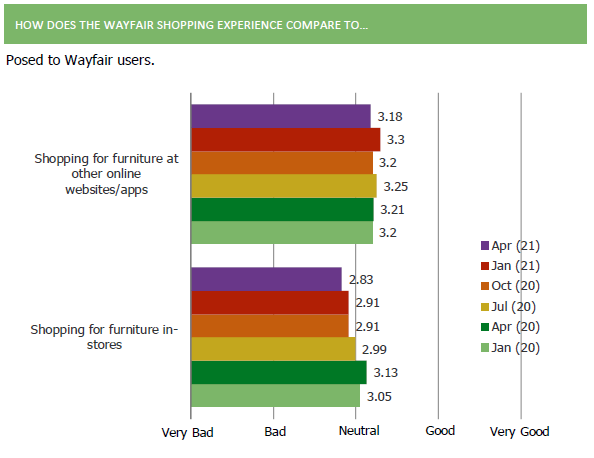
One year ago, consumers were suggesting that furniture would be one of the areas in which Covid behaviors would eventually swing back to look closer to pre-Covid dynamics (online vs. in-store furniture).
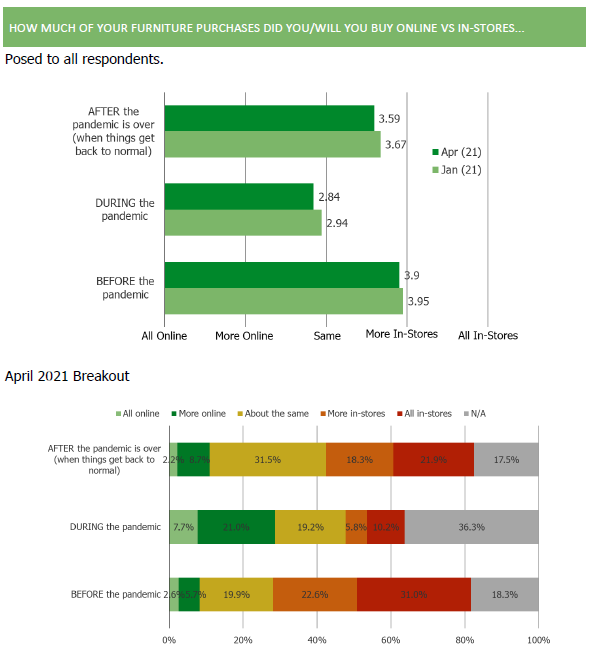
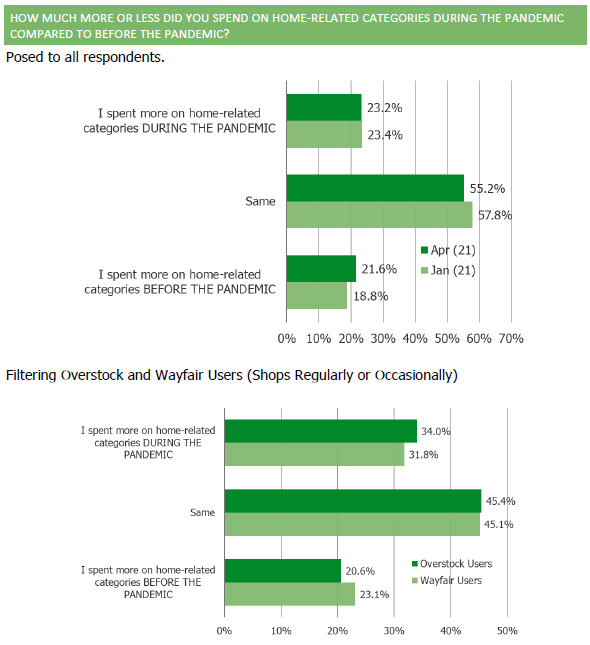
Home-related category spending got a boost from Covid (Wayfair and Overstock customers, in particular, reported this to us one year ago).
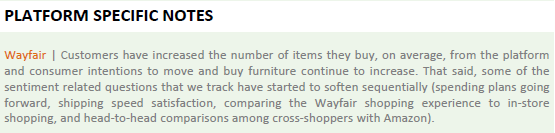
But as early as April of 2021, some of the customer sentiment and look-forward KPIs that we track started to soften.
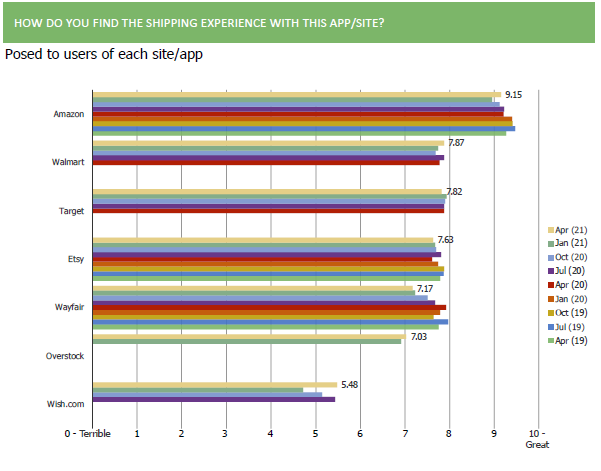
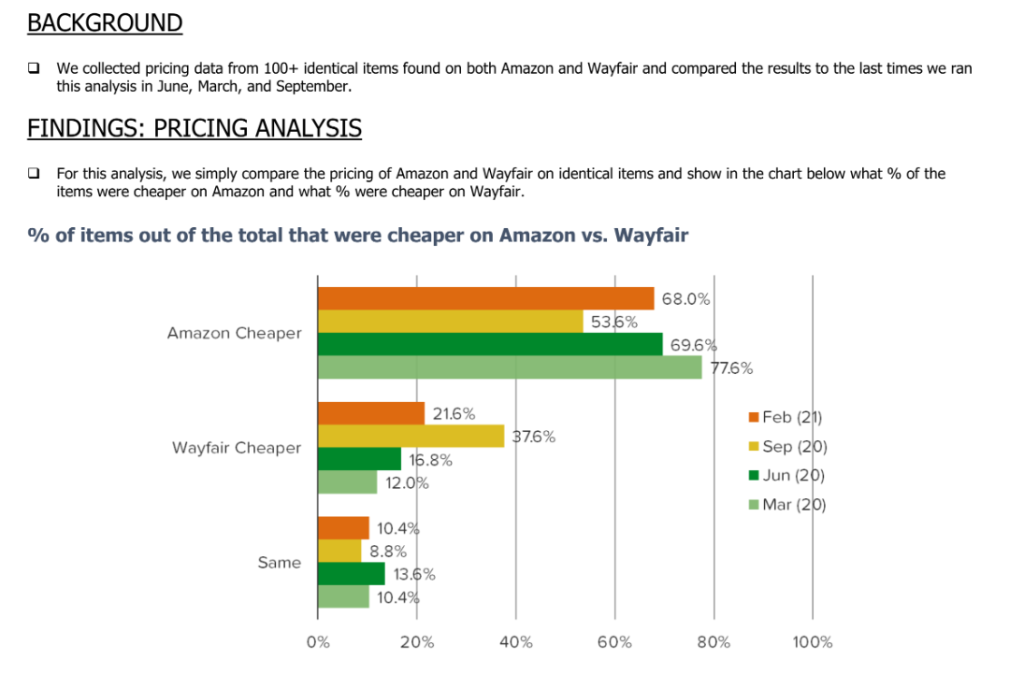
Amazon/Wayfair identical item cross-shopping was increasing, with sentiment shifting toward Amazon.
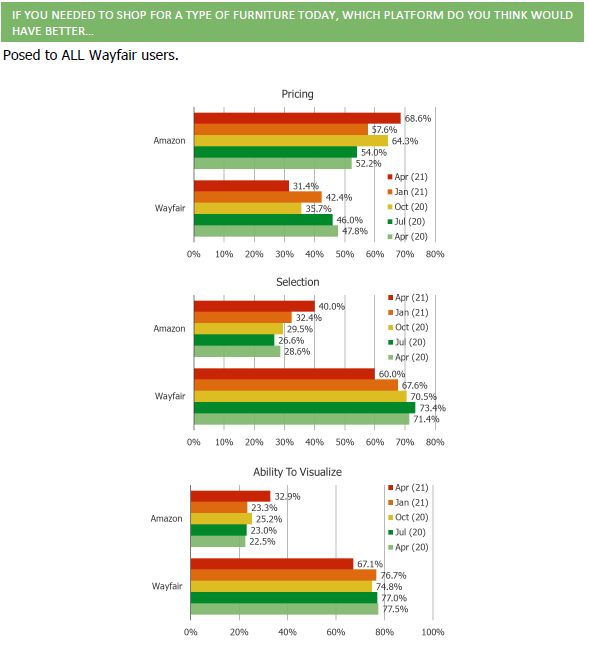
And from our identical item pricing analysis work (not survey work, this is from our work in which we visually match and manually record pricing across 100+ identical items on both platforms each quarter) – Wayfair lost some of the pricing benefit it had gained in September 2020 (at the height of Amazon’s shipping issues, in which they seemed to back off on pricing competitiveness during that quarter).