Blog
Bespoke Survey Insights
Streaming Video Monthly Update | Top Three Takeaways
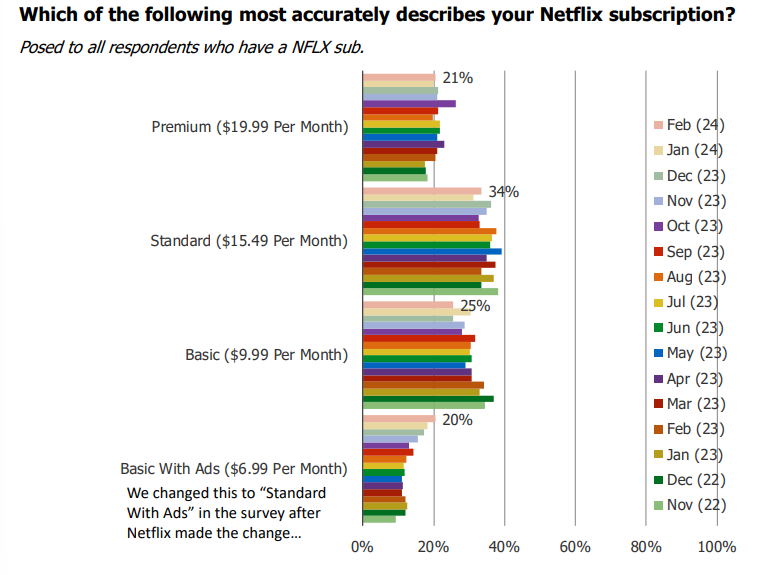
1. The share of customers saying they are on the ad-supported plan has been increasing sequentially in our monthly survey.
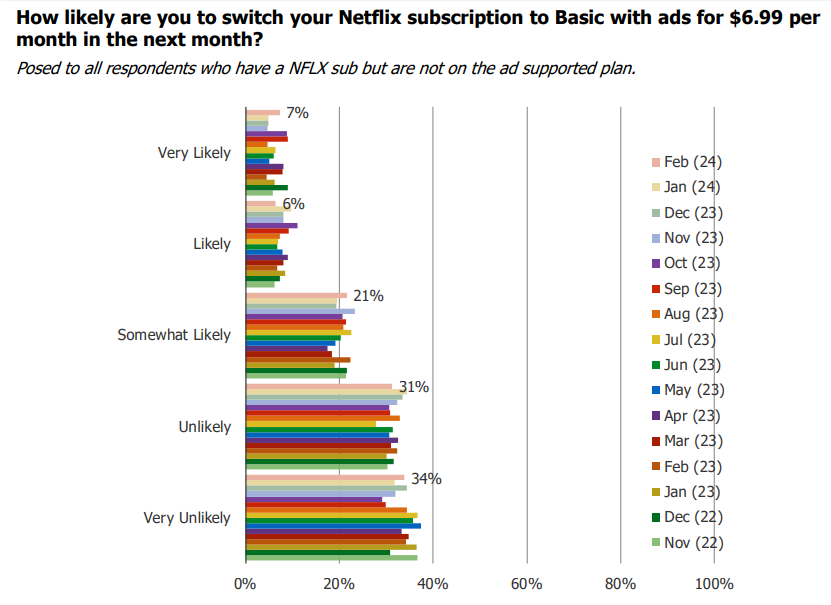
2. The share of respondents who reported that they are very likely to switch subscription packages has increased q/q.
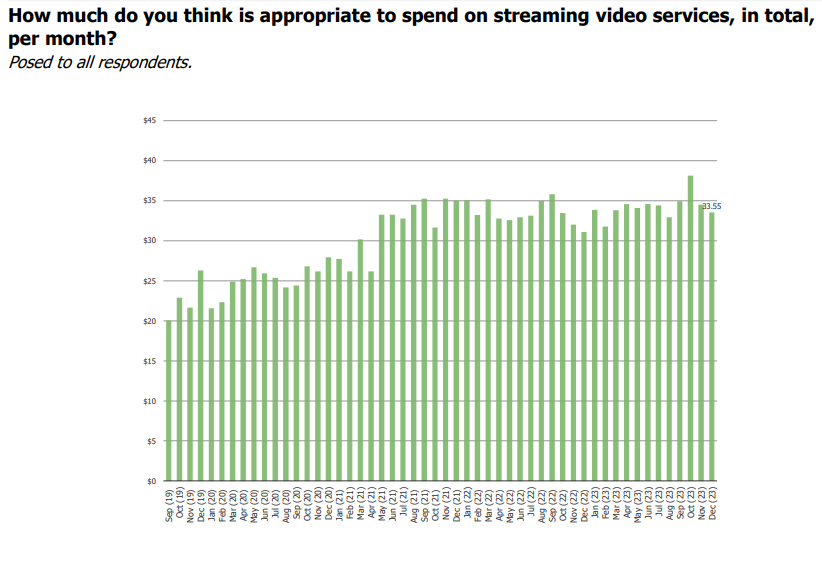
3. The amount that consumers believe is an appropriate price to pay for streaming services has declined over the past few quarters.
Mobile Payments, Crypto, and Investments | Top Three Takeaways
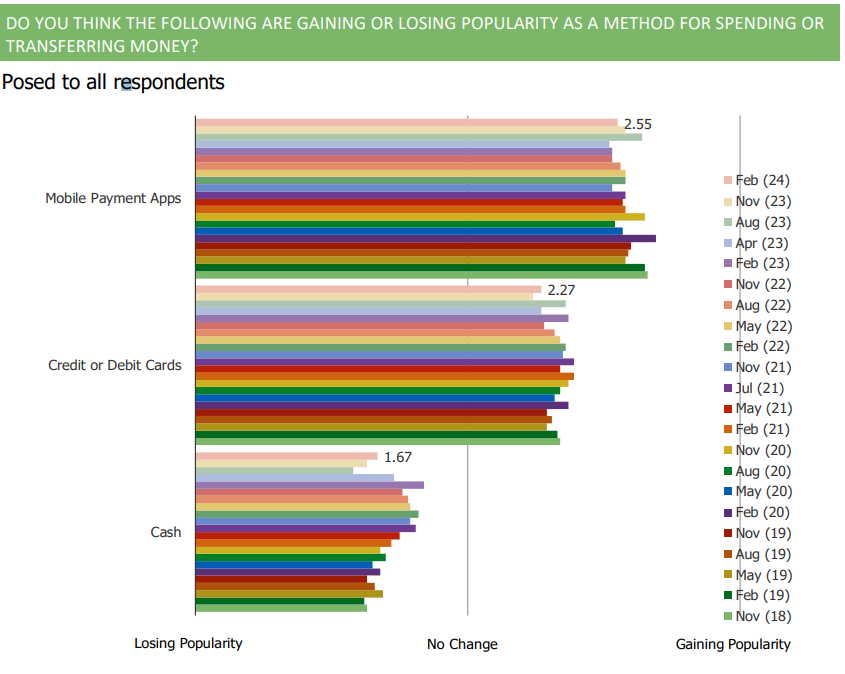
1. Respondents have been noting that they feel as if mobile payment apps have decreased in popularity over the past few quarters.
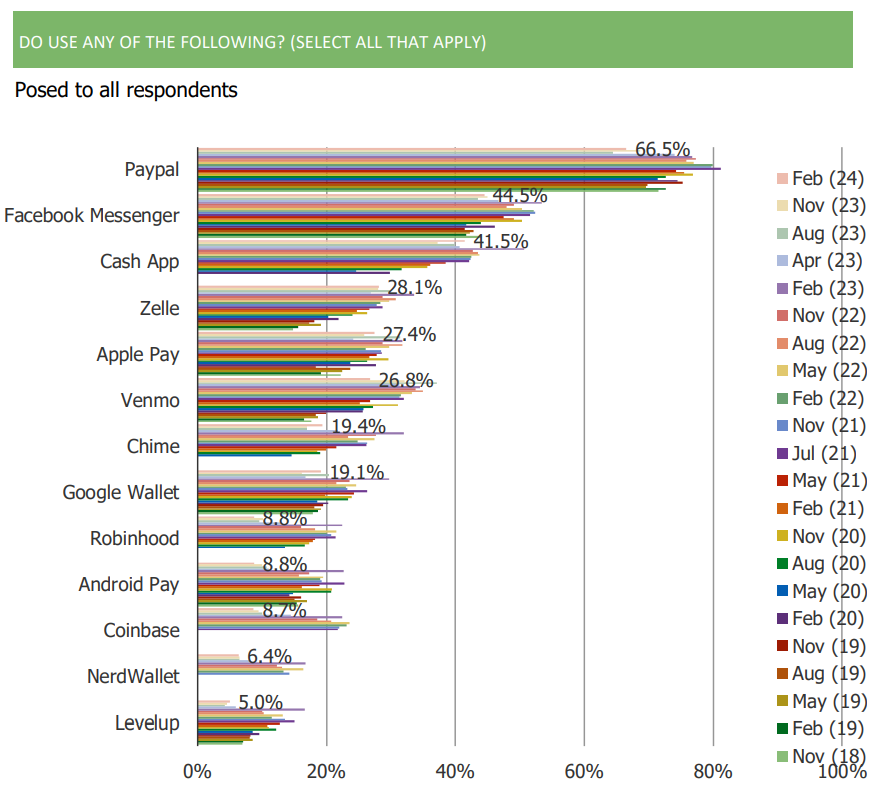
2. PayPal usage has increased q/q and remains the most popular of the payment apps that we test.
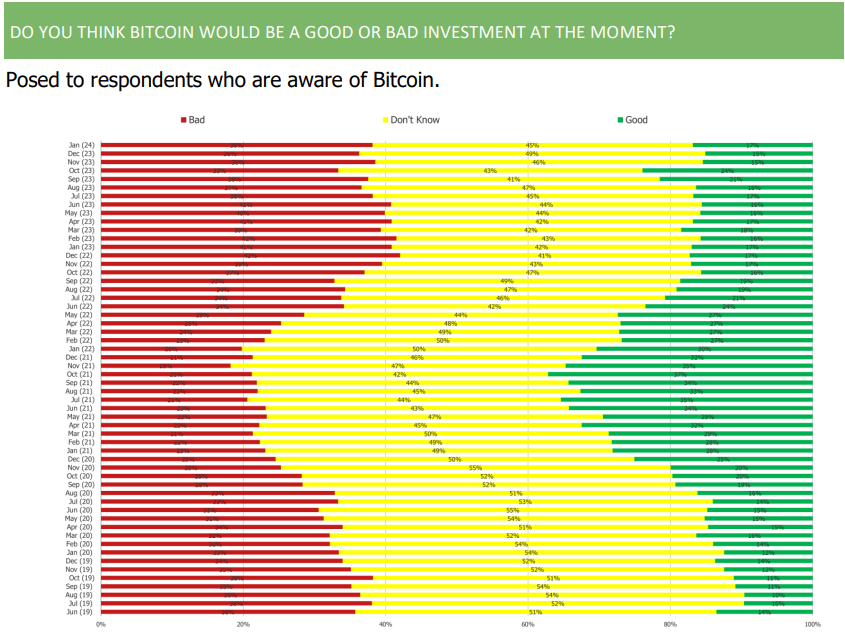
3. The share of respondents who believe that Bitcoin would be a bad investment increased q/q.
AI Chatbots | Top Three Takeaways
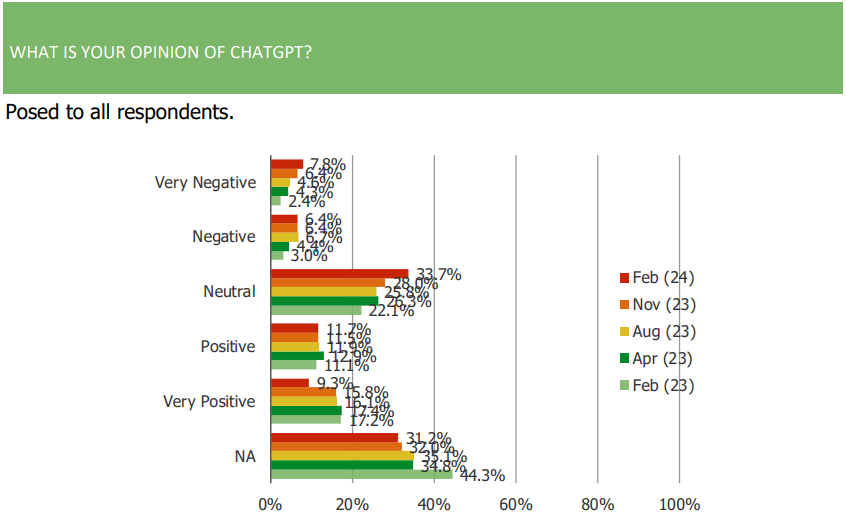
1. The share have consumers who have tried AI chatbots like ChatGPT has increased, but overall satisfaction/sentiment toward those offerings worsened q/q.
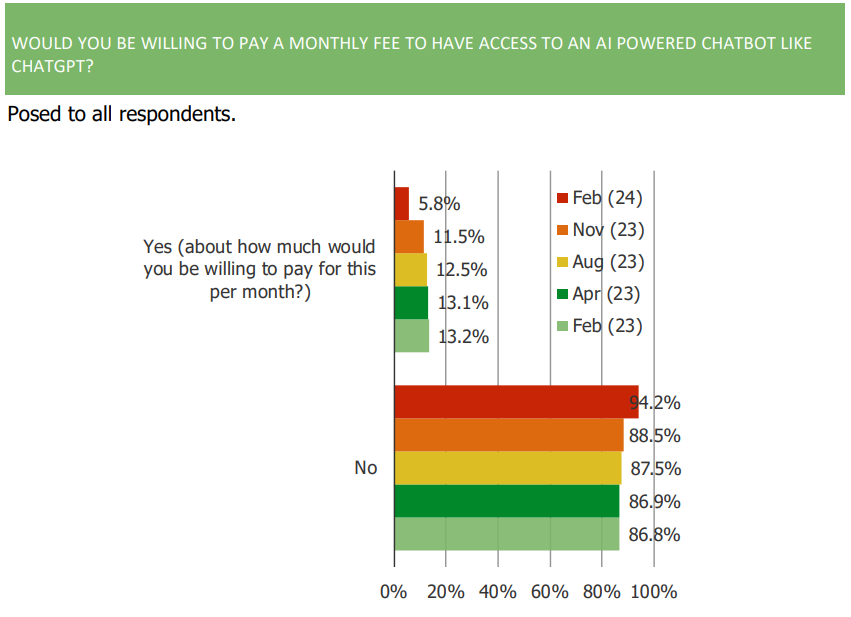
2. A decreasing number of respondents would pay a monthly fee for access to ChatGPT or other AI chatbots.
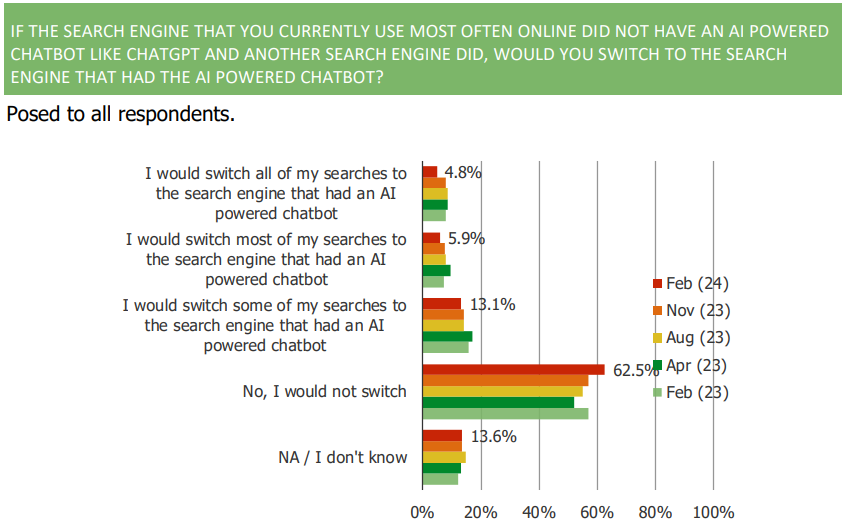
3. The majority of respondents would not switch from the search engine that they currently use, to one that has an AI powered chatbot.
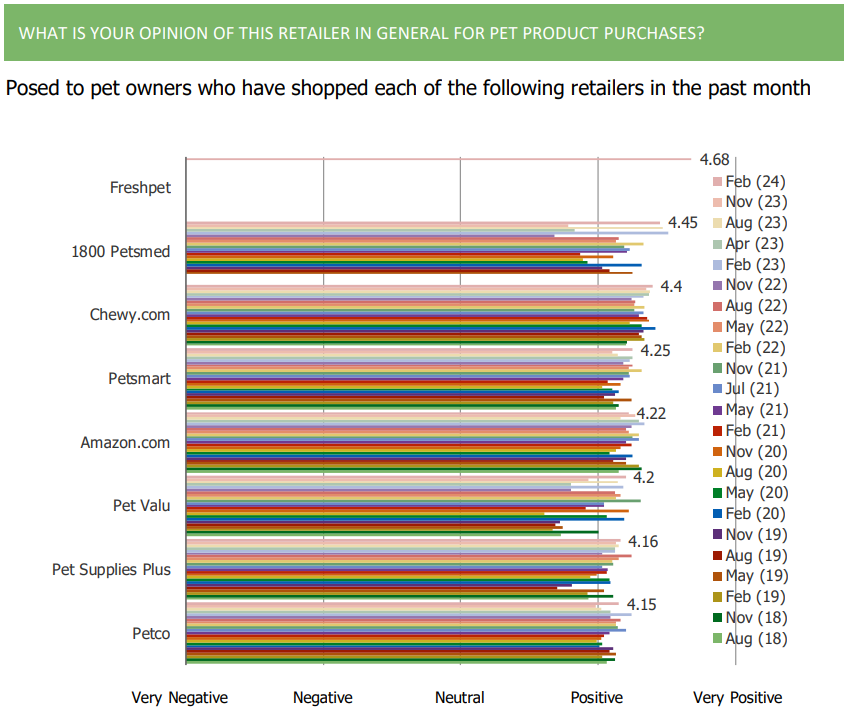
Pet Retail & Pet Health | Top Three Takeaways
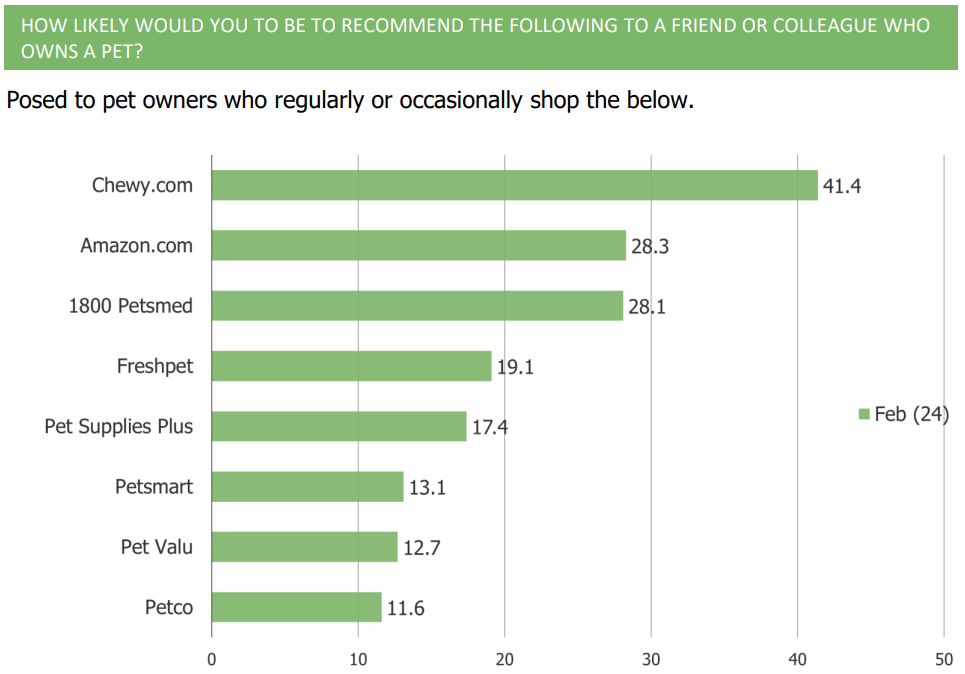
1. Chewy NPS came in at ~41, while Freshpet came in at ~19
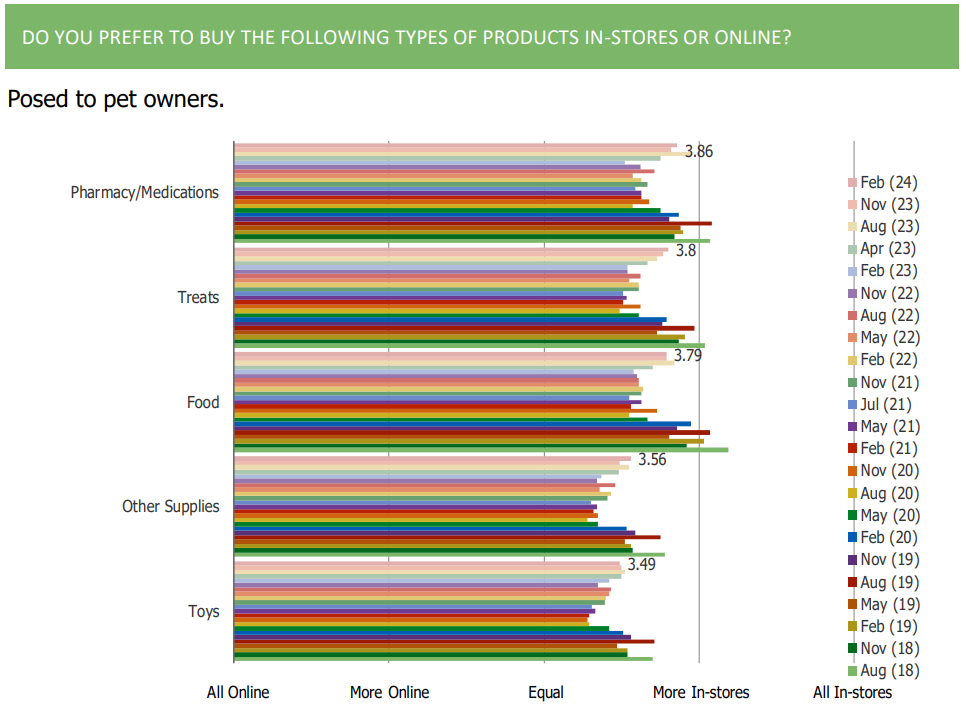
2. Pet owners shifted their shopping preferences in the direction of online buying during the pandemic quarters of our survey’s history. In the quarters following the pandemic, preferences have shifted a bit back in the direction of in-store.
3. Customer opinions of Freshpet are very positive and a touch stronger relative to Chewy, Petsmart, and Petco.
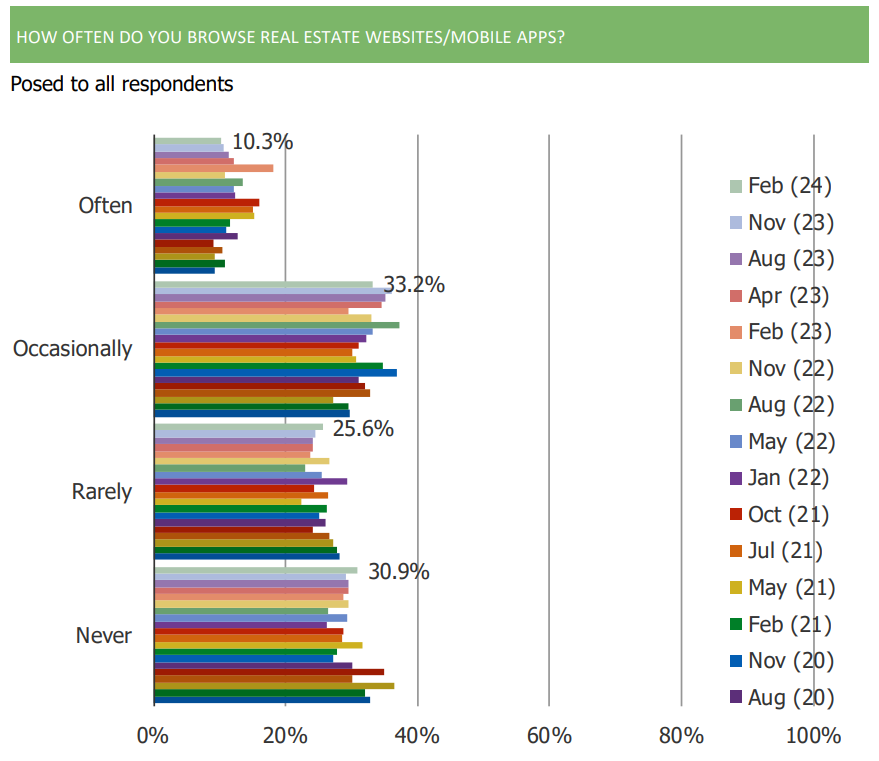
Online Realtors | Top Three Takeaways
1. The share of consumers browsing real estate websites often has been softening sequentially.
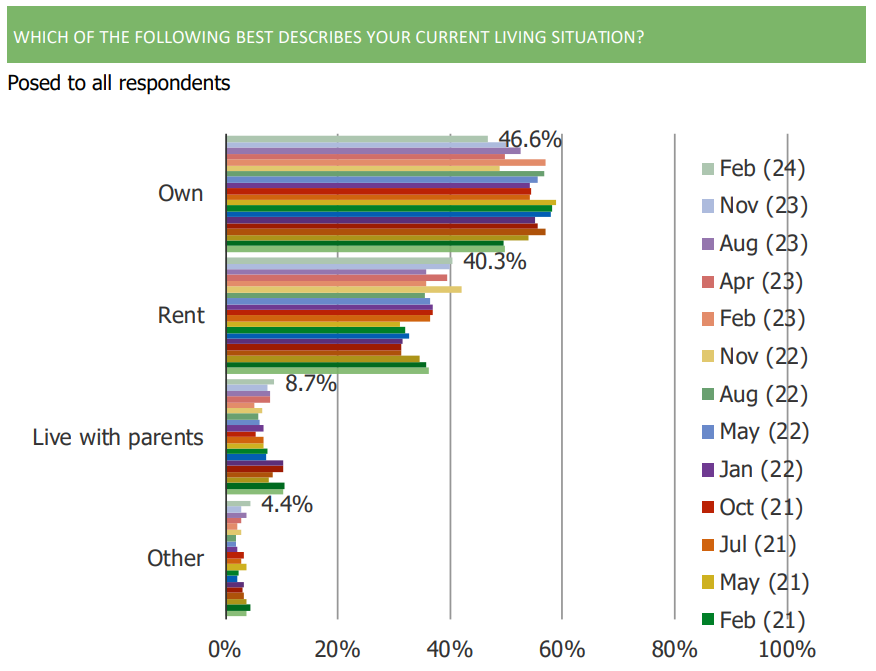
2. The share of respondents who rent their current living space has increased over the past few quarters.
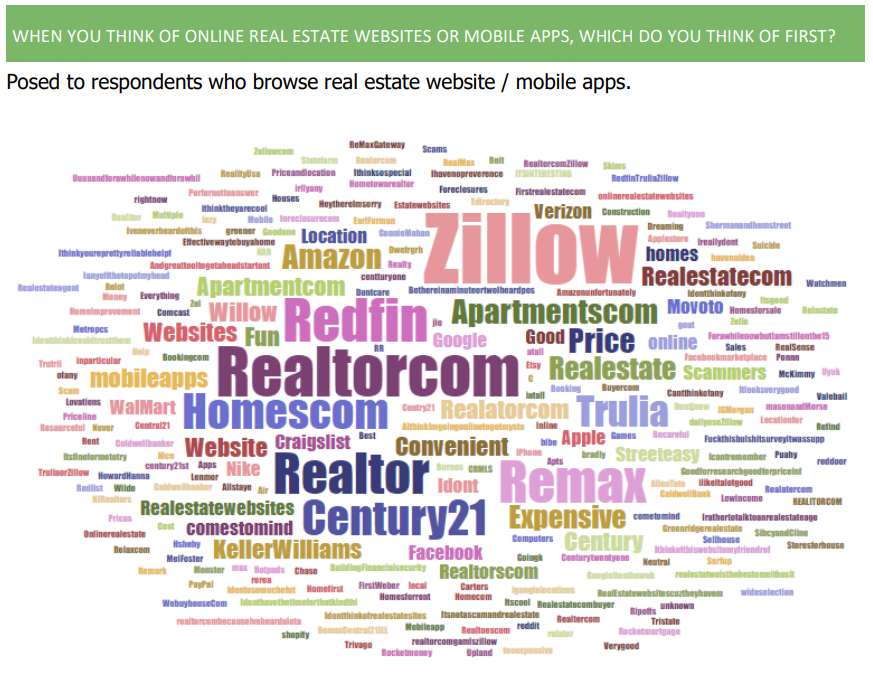
3. Zillow, Redfin, and Realtor.com are all names that are top of mind for consumers when they think of online real estate websites.
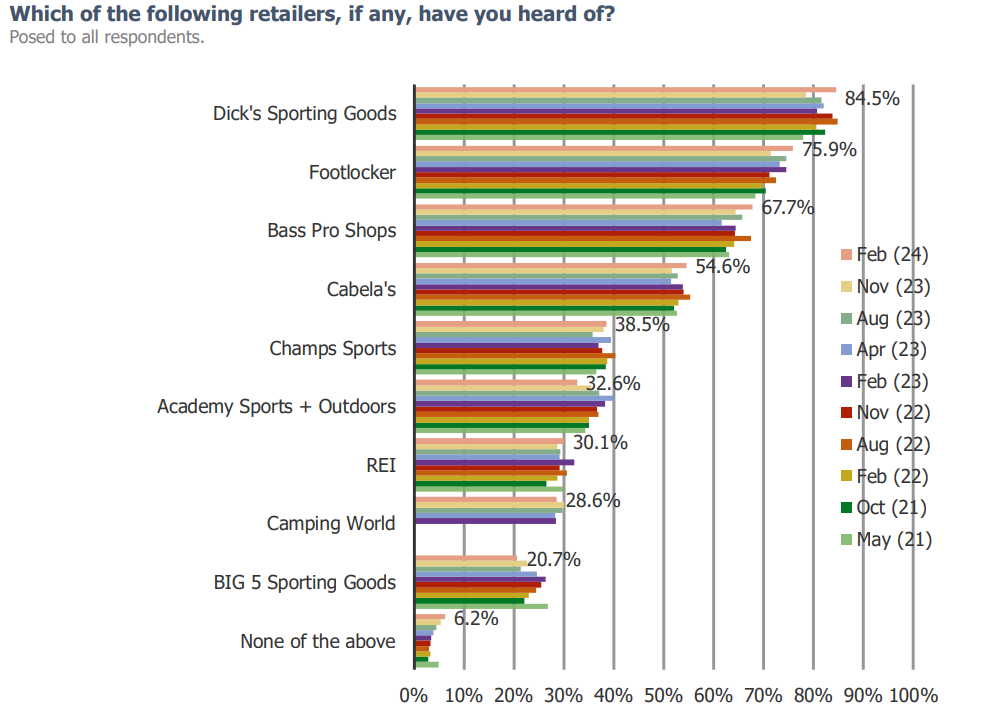
Sporting Goods | Top Three Takeaways
1. Dick’s Sporting Goods remains the most recognized sporting goods retailer.
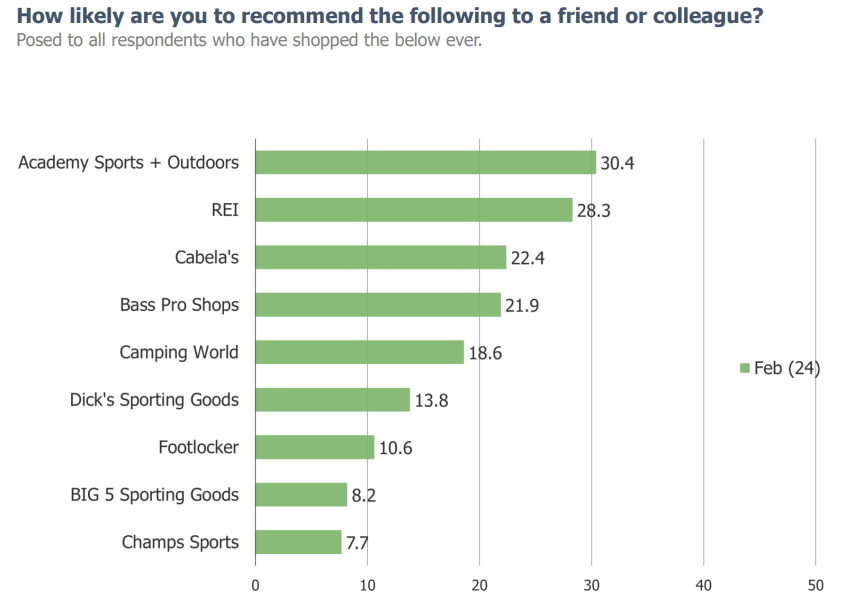
2. ASO NPS comes in at 30.4.
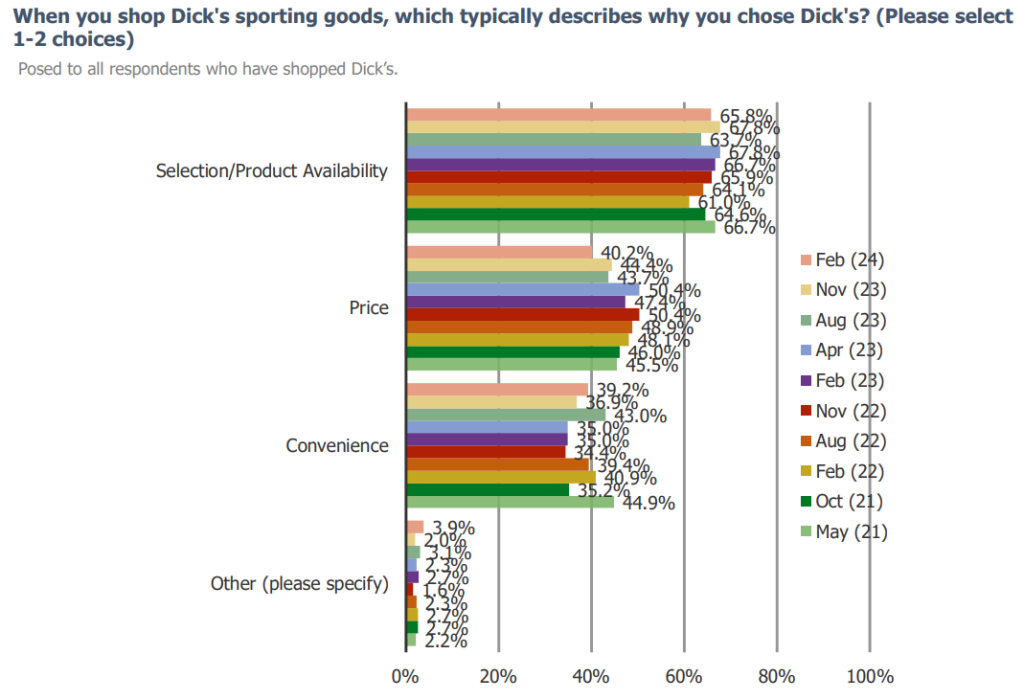
3. Consumers have been decreasingly likely to be driven to go to Dick’s by the pricing.
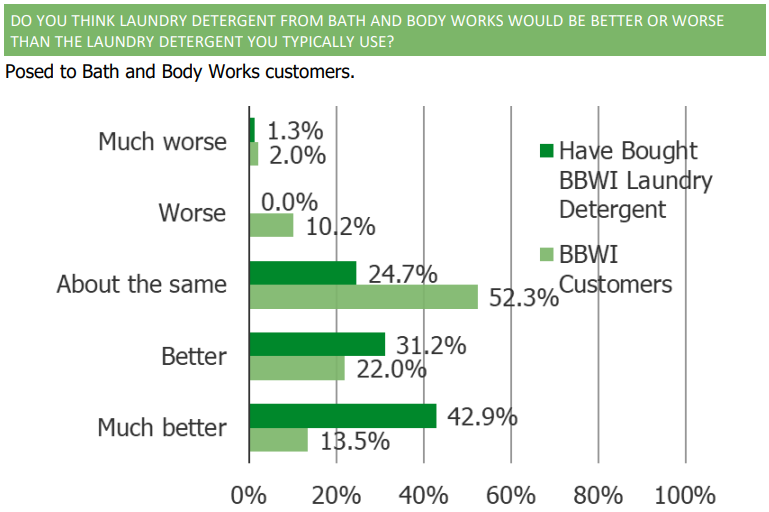
BBWI | Top Three Takeaways
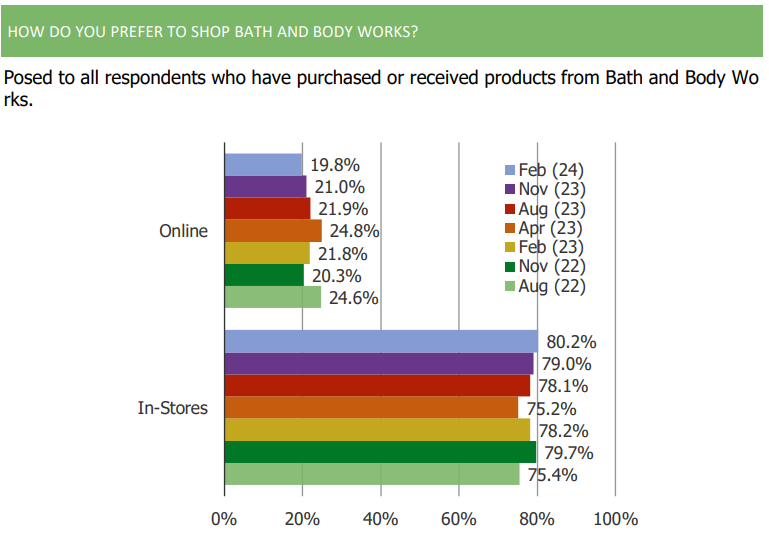
1. The majority of consumers prefer to shop at Bath & Body Works in-store as opposed to online.
2. A plurality of consumers who have purchased laundry detergent from Bath & Body Works believe that it is much better than other detergent brands.
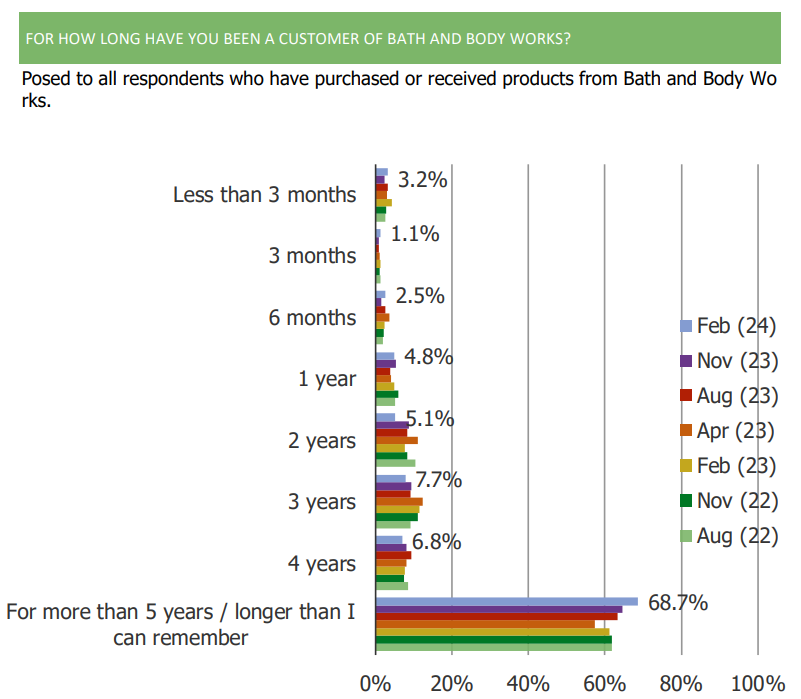
3. 68.7% of respondents report being a customer of Bath and Body Works for 5 years or more.
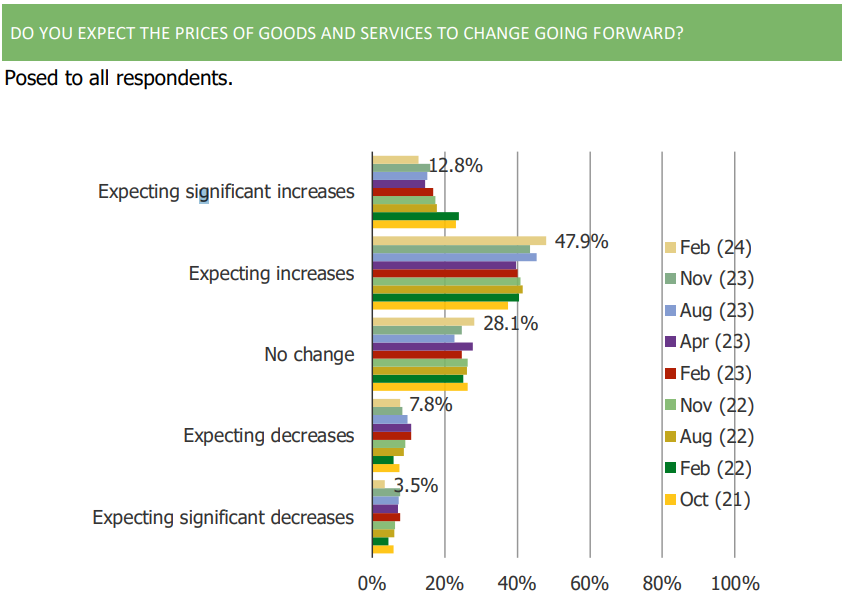
Inflation Expectations | Top Three Takeaways
1. The share of consumers who expect increases in prices continues to be greater than the share who expect price decreases.
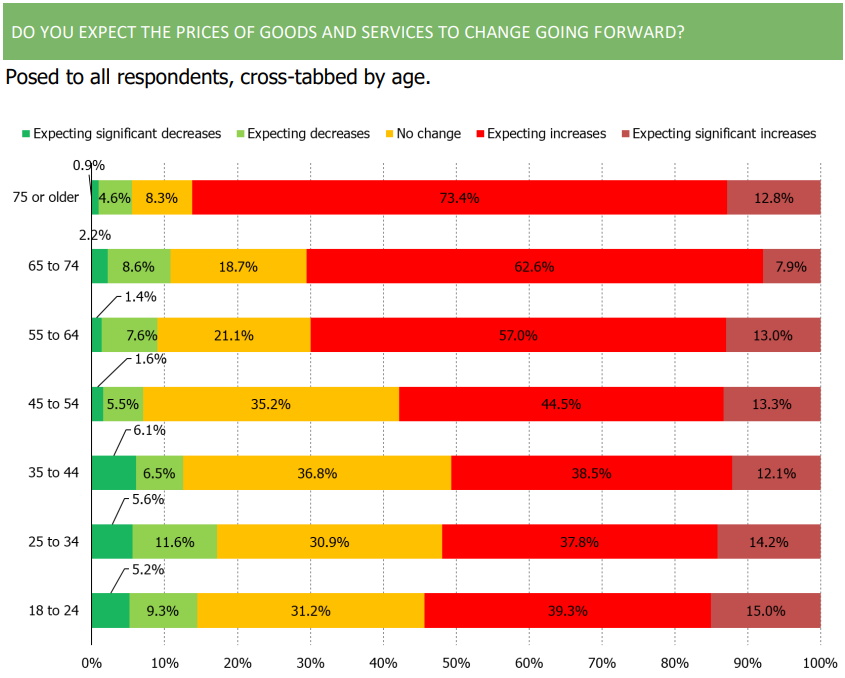
2. The general trend is that the older the consumer, the more inflation they expect moving forward.
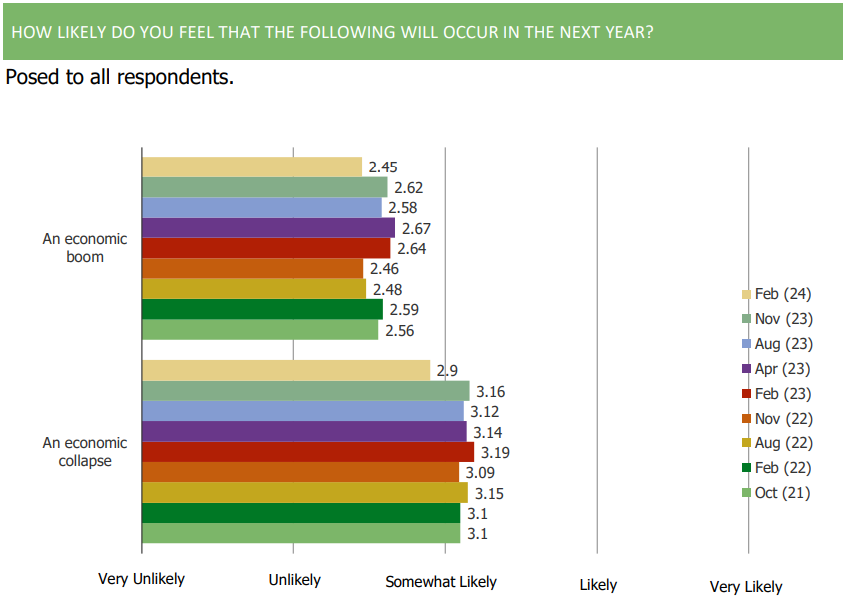
3. Consumer sentiment remains downbeat with people more likely to expect an economic collapse than they are to expect an economic boom in the next year.
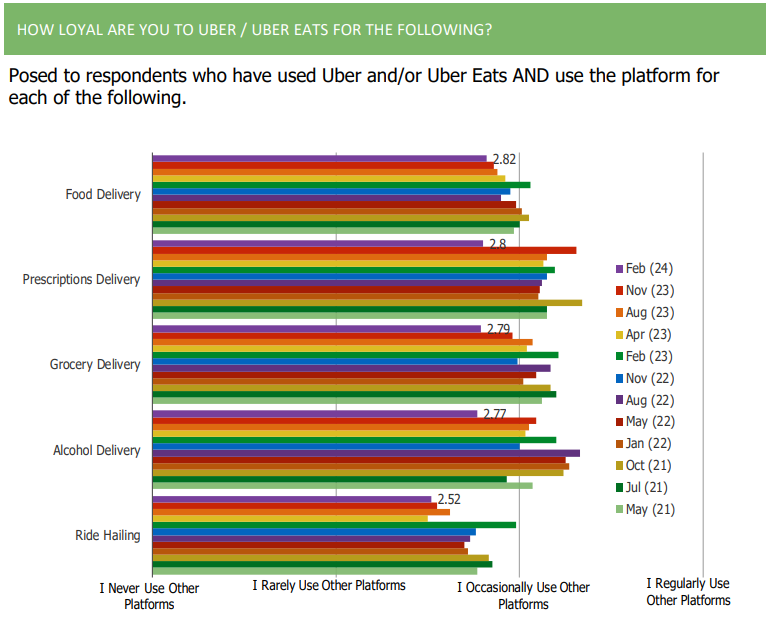
Ride Sharing & Food Delivery | Top 5 Takeaways
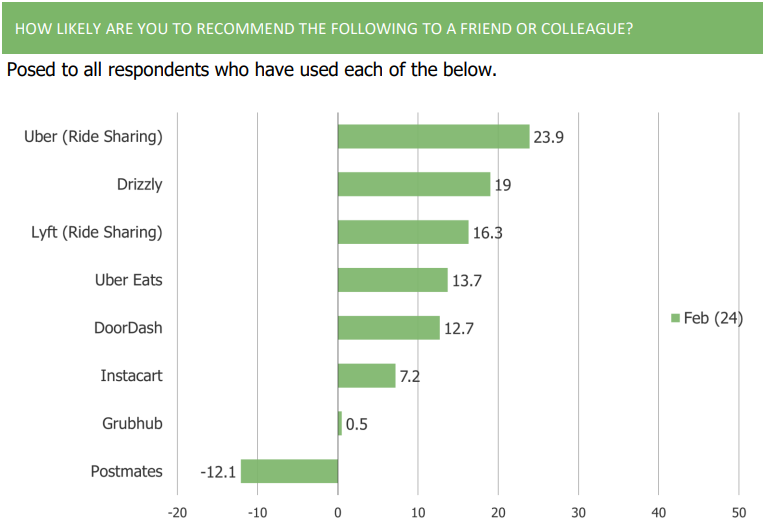
1. Uber ride sharing tops competitors in the space for NPS, coming in at 23.9.
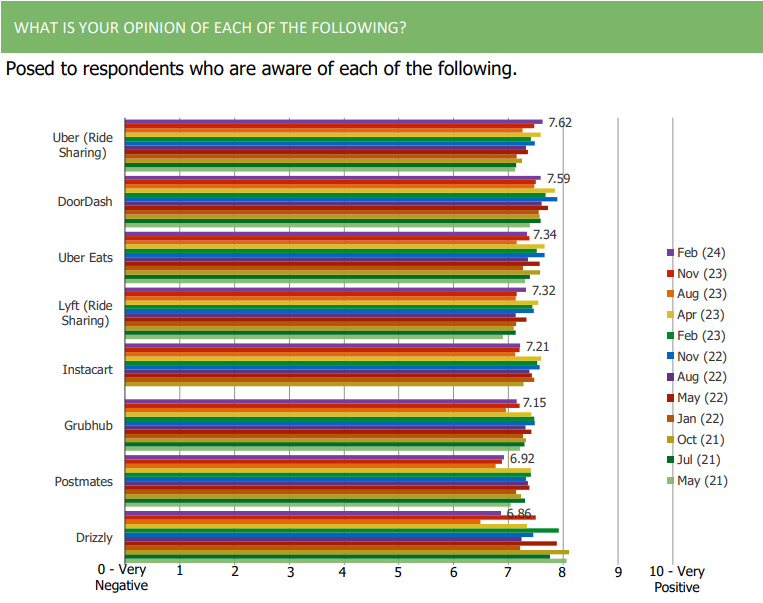
2. Sentiment toward Uber ride sharing is positive and has improved over the history of our survey.
3. Among those who have ever used each platform tested in our survey, Instacart and Postmates have the highest share of folks who say they don’t use it anymore.
4. Uber customer loyalty has increased sequentially in our survey for pretty much all different use cases for Uber / Uber Eats.
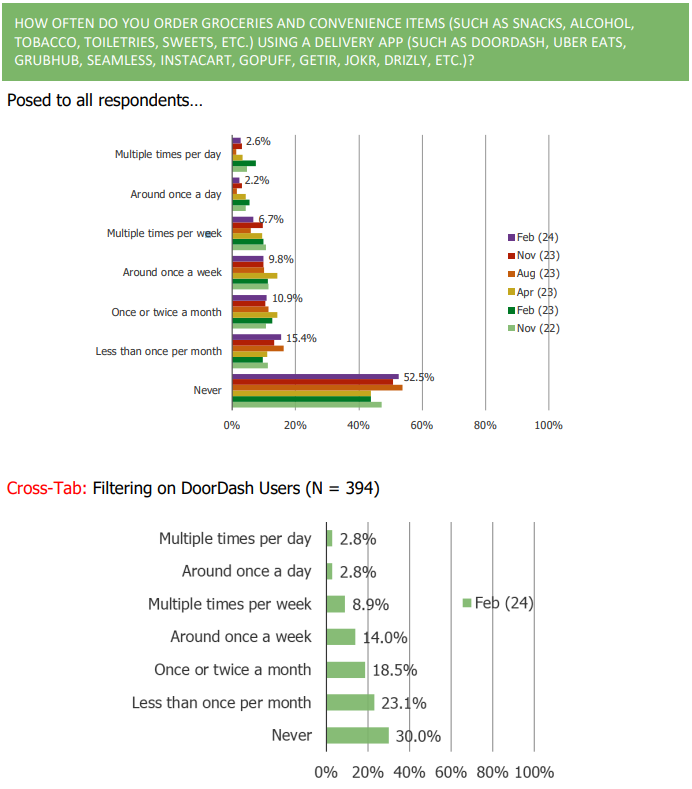
5. Turning to Dashmart, the share of consumers who say they order groceries and
convenience items using a delivery app has declined over the past year+
Footwear & Athletic Wear | Top Five Takeaways
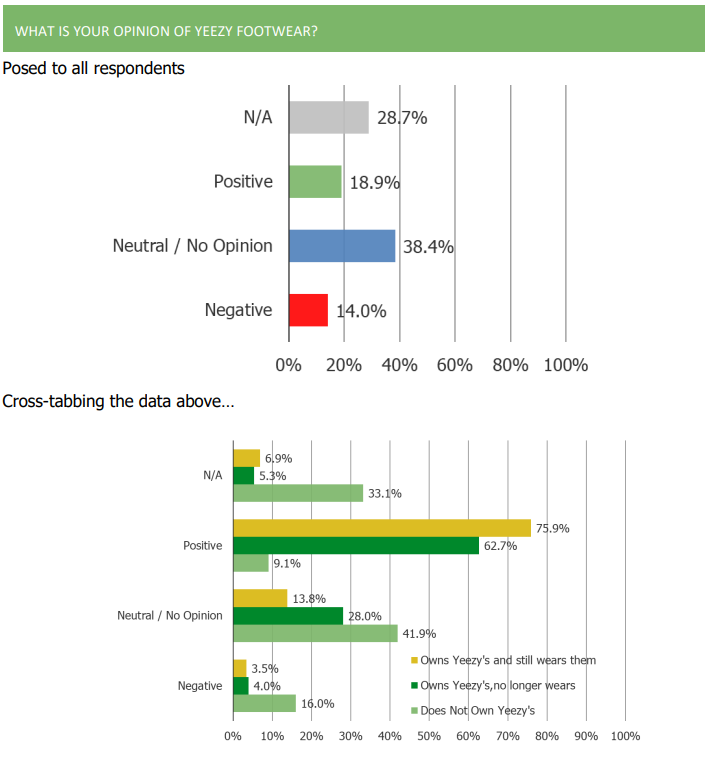
1. While there are some consumers who have a negative opinion of Yeezy sneakers (with sentiments related to Kanye West and his comments in recent years being flagged as reasons for negative sentiments), the broader consumer audience has a net positive view of the brand/sneakers.
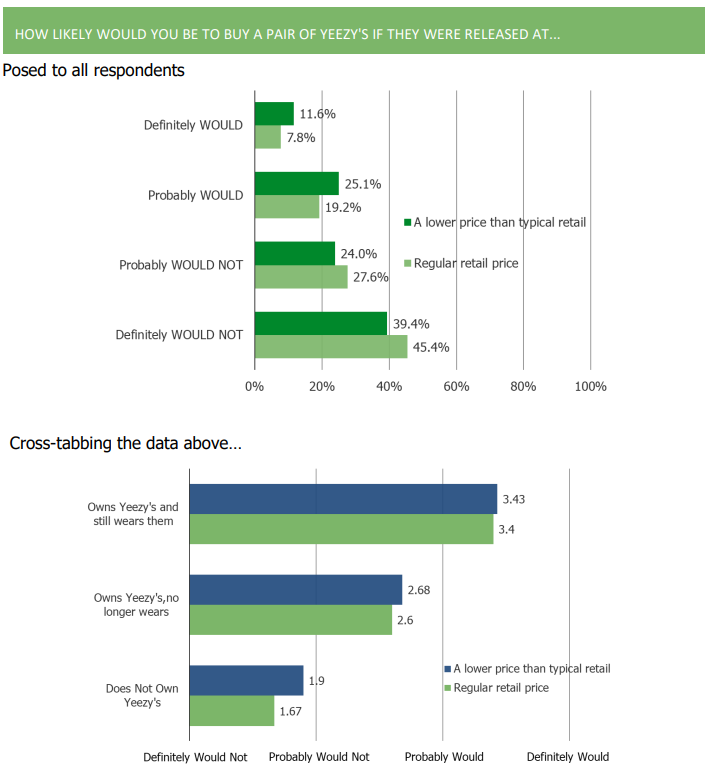
2. Consumers are open to buying Yeezy sneakers, especially at lower price points than
retail. Consumers who currently own and wear sneakers reported that they would be
very likely to buy Yeezy’s if released at a lower price point (or at full retail).
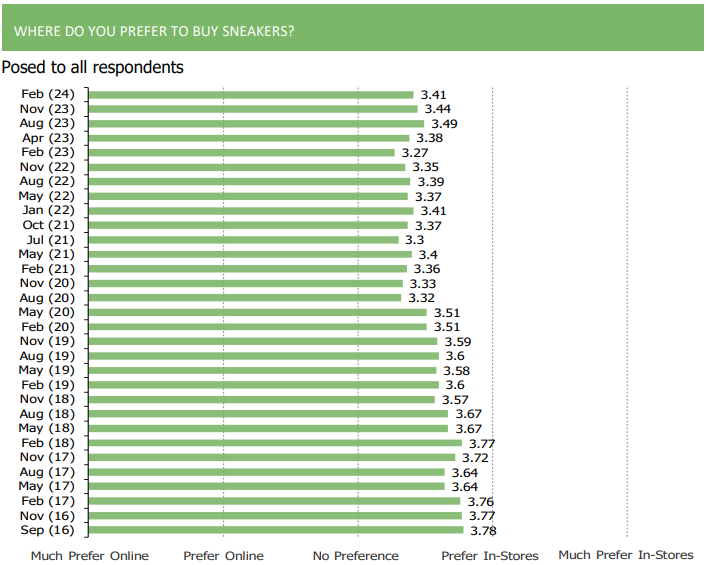
3. Over the history of our survey, consumers have shifted their buying preferences for
footwear toward online and direct, but those trends have been more stable of late. We
continue to note that the most frequent footwear buyers are more likely than infrequent buyers to prefer online and direct from the brand.
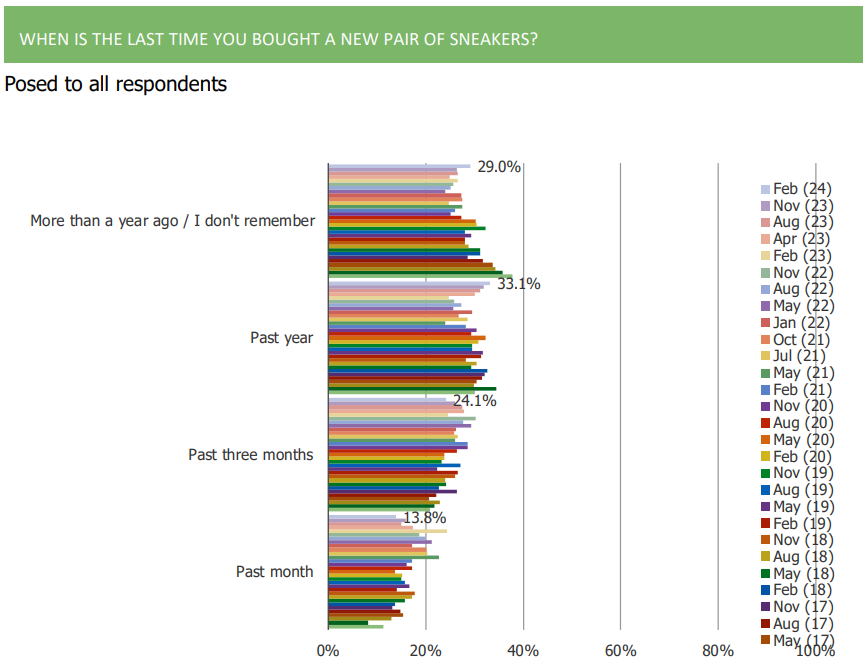
4. Among the broader audience, self-reported footwear purchase recency and frequency have softened over the past year or so.
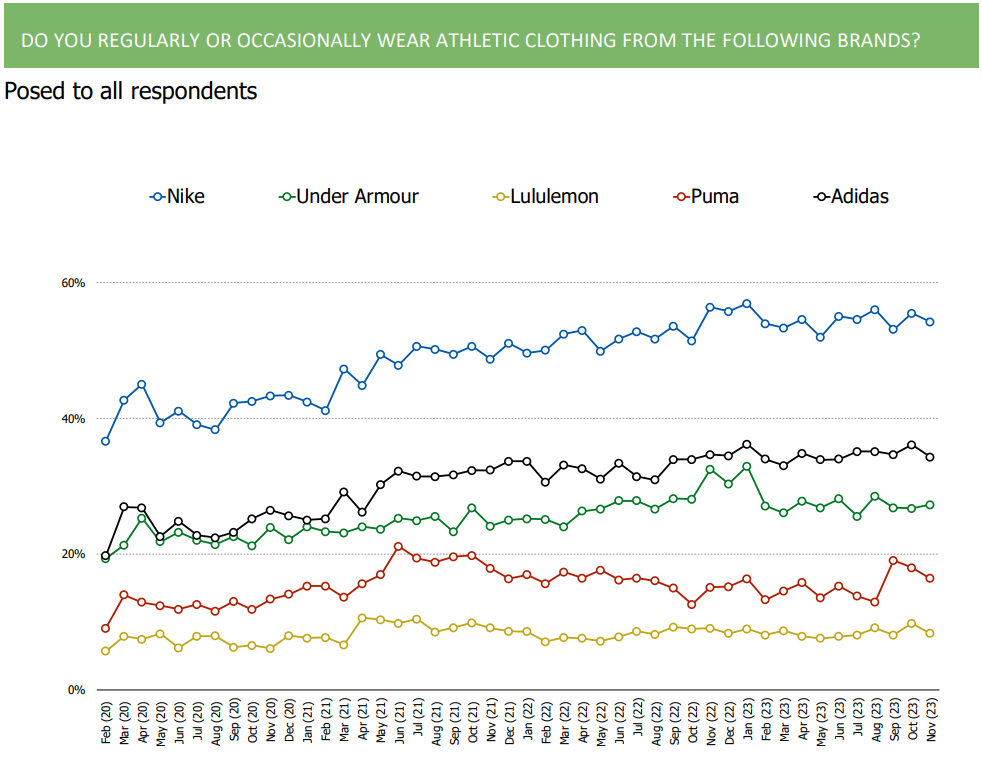
5. When it comes to athletic performance relative to competition, both Nike and Lululemon have boosted customer sentiment that they are superior over-time.
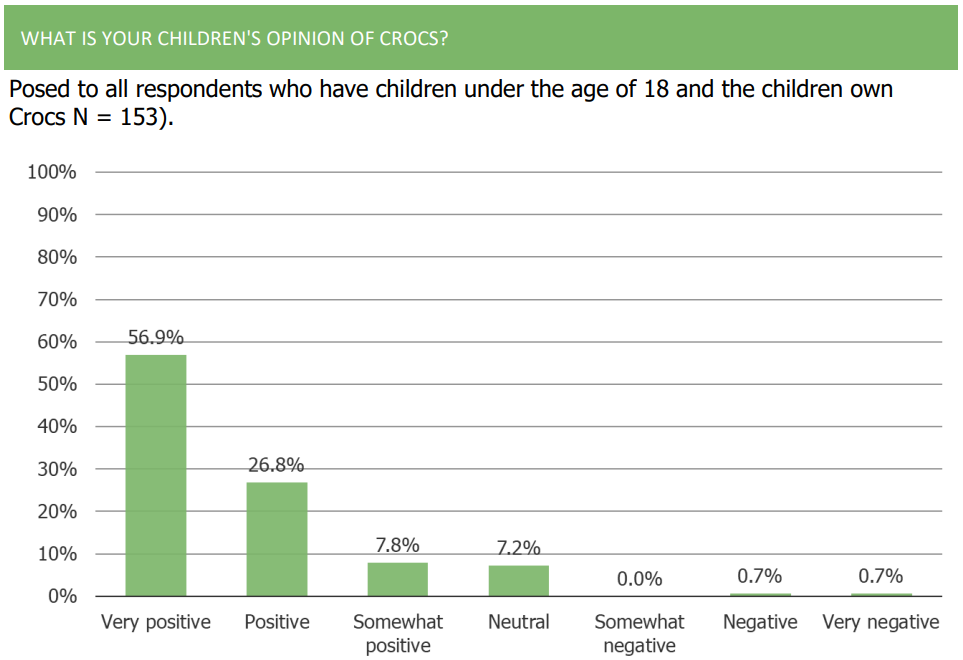
Crocs | Top Five Takeaways
1. Children have an overwhelmingly positive view on Crocs.
2. The share of consumers that said that they own a pair of Crocs has been stable sequentially.
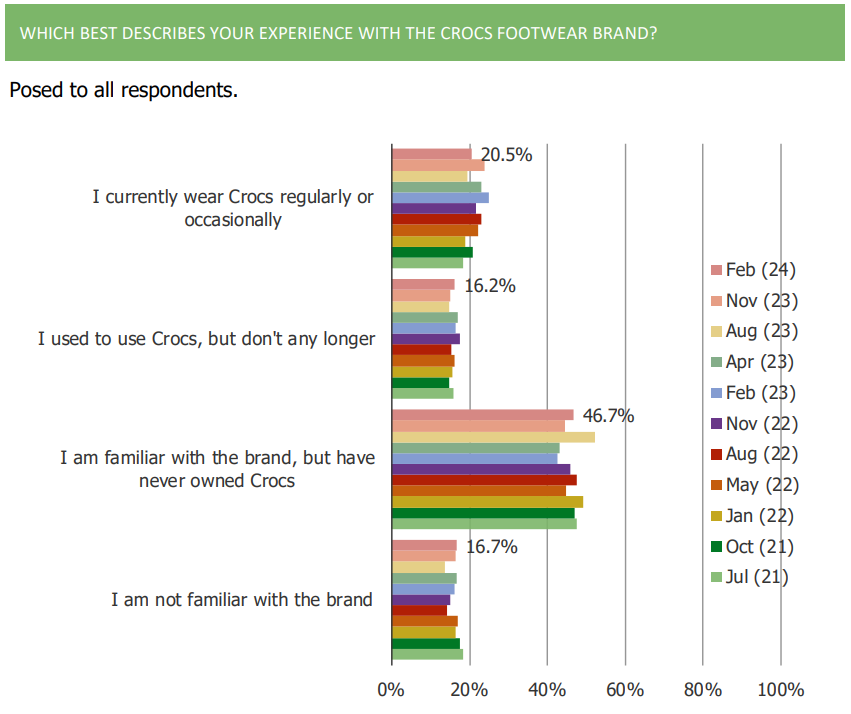
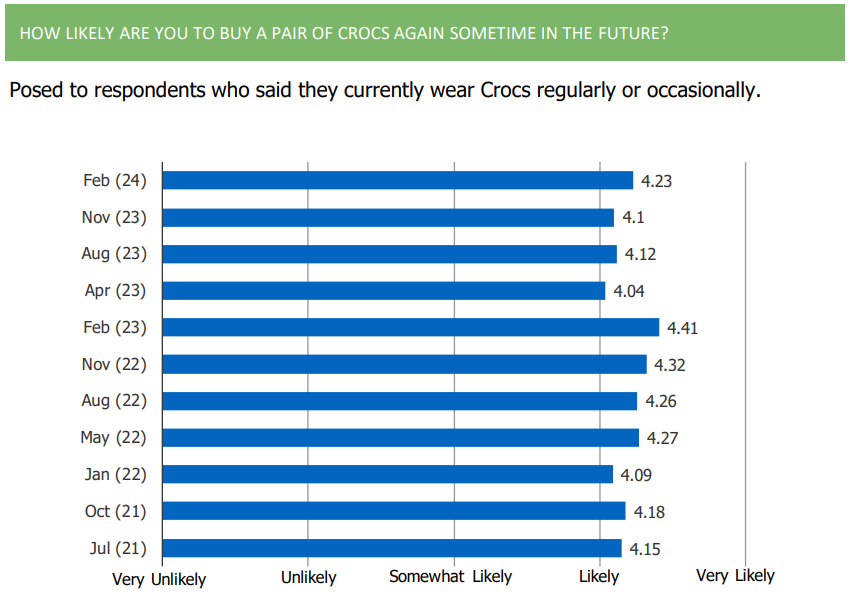
3. NPS and other metrics around likelihood to purchase another pair of Crocs in the future (among those who currently own a pair) increased q/q and remains positive.
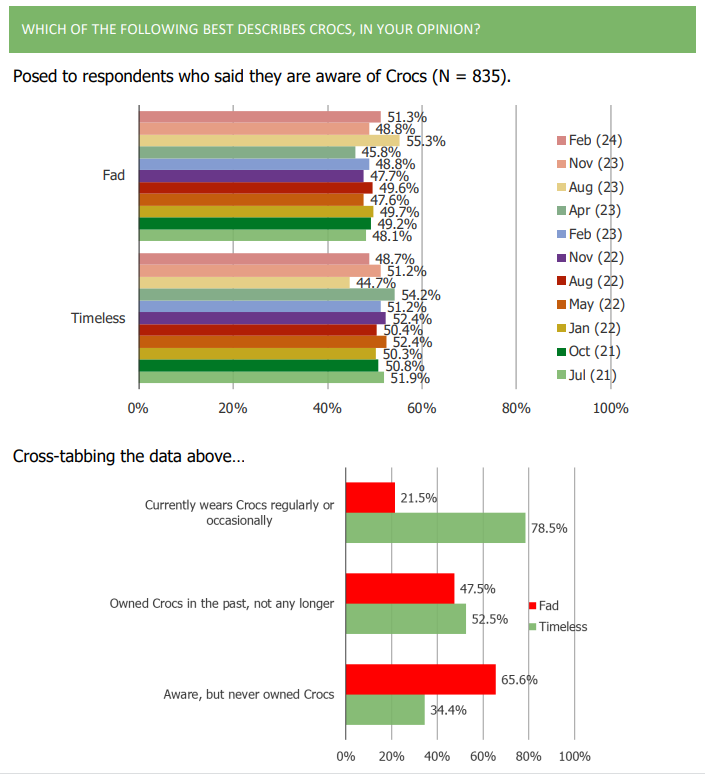
4. Crocs owners have settled into increasingly agreeing that Crocs are a staple they’ll always have in their closet and decreasingly view them as just a fad.
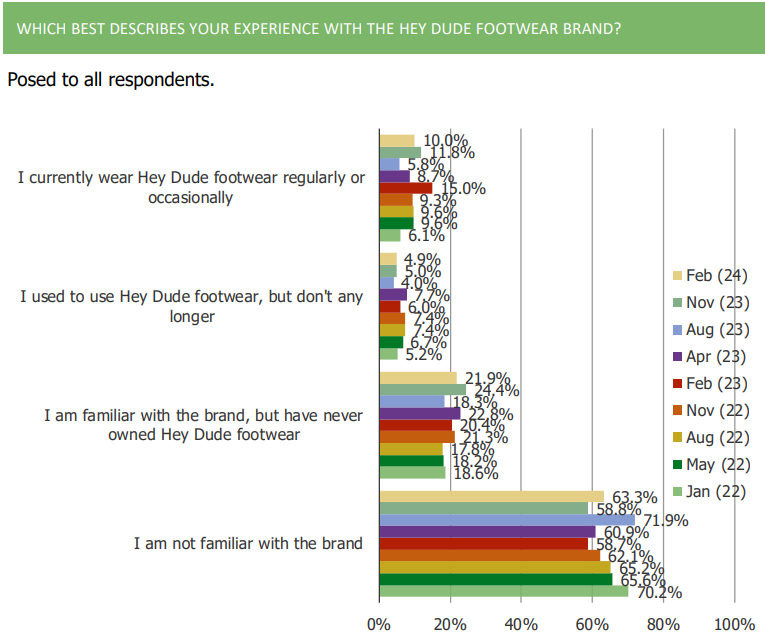
5. Feedback around Heydude is positive with both awareness and those who wear them increasing over time.
CPGs, Beer, and Hard Seltzer | Top Five Takeaways
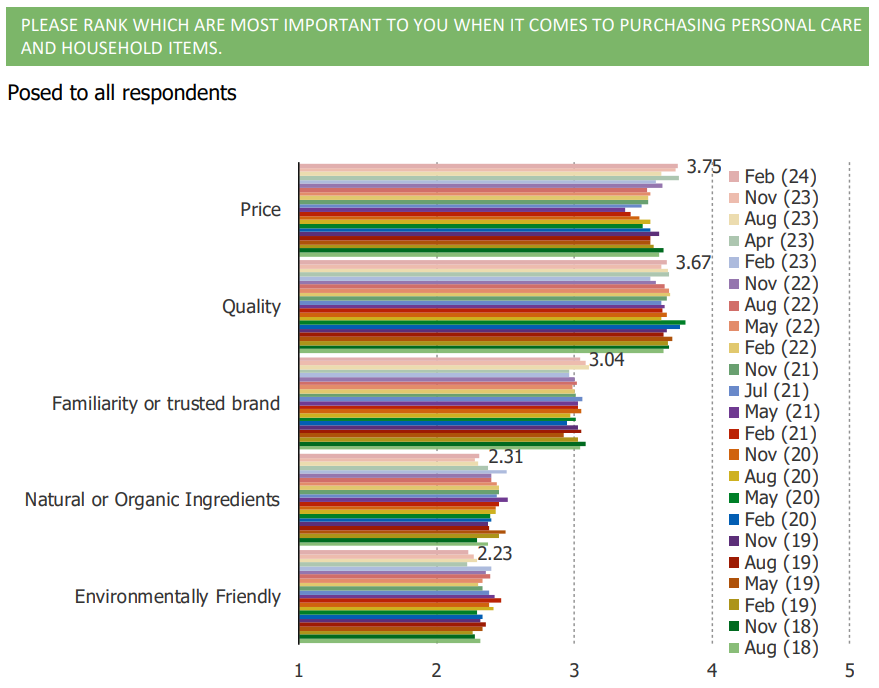
1. Price remains top of mind for consumers when it comes to CPG product purchases.
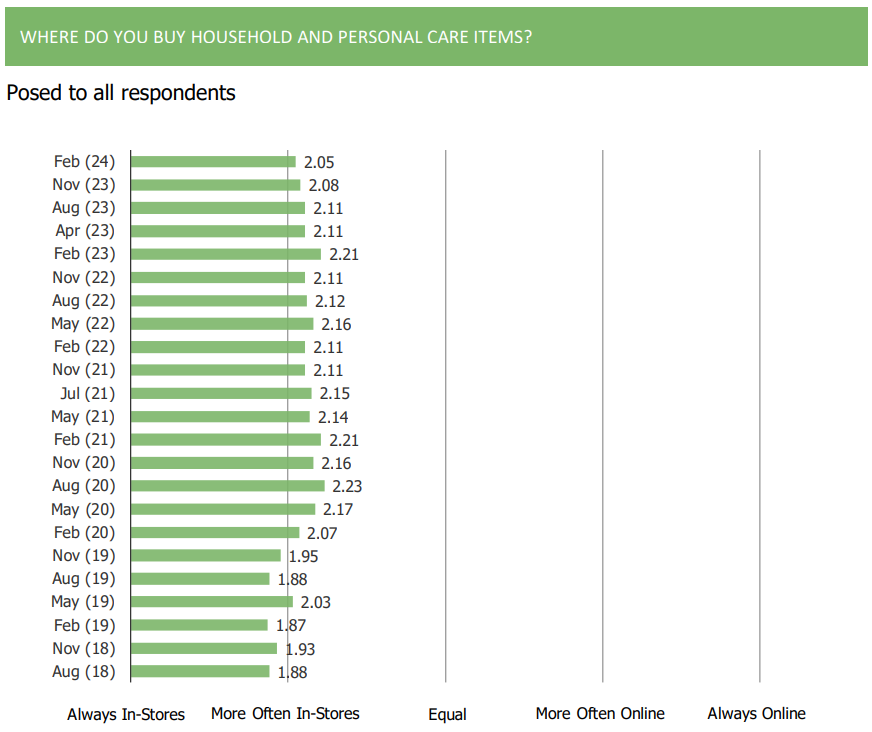
2. Consumers continue to show a strong preference for in-store purchases of household and personal care products.
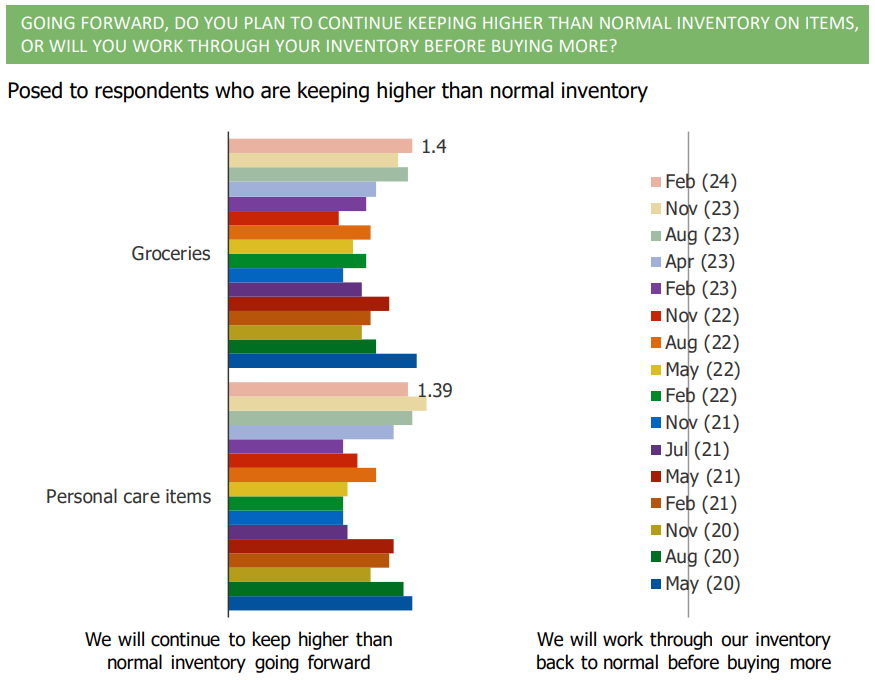
3. Consumer CPG purchasing trends are more stable q/q after a period of time post-Covid in which consumers self-reported that they were spending through inventory and not spending as aggressively across categories.
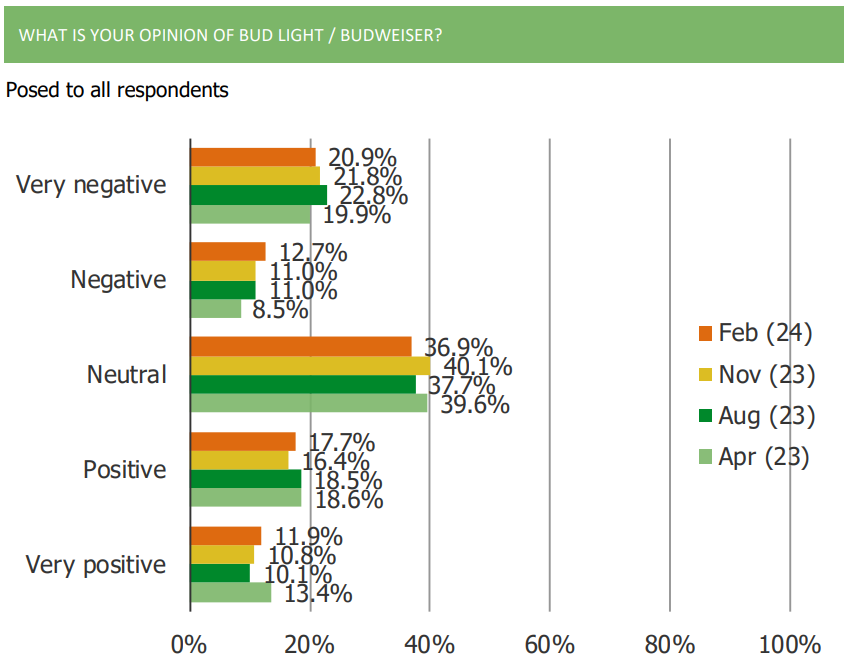
4. Feedback toward Bud Light has improved sequentially with the share who plan to decrease their purchases declining sequentially relative to three months ago.
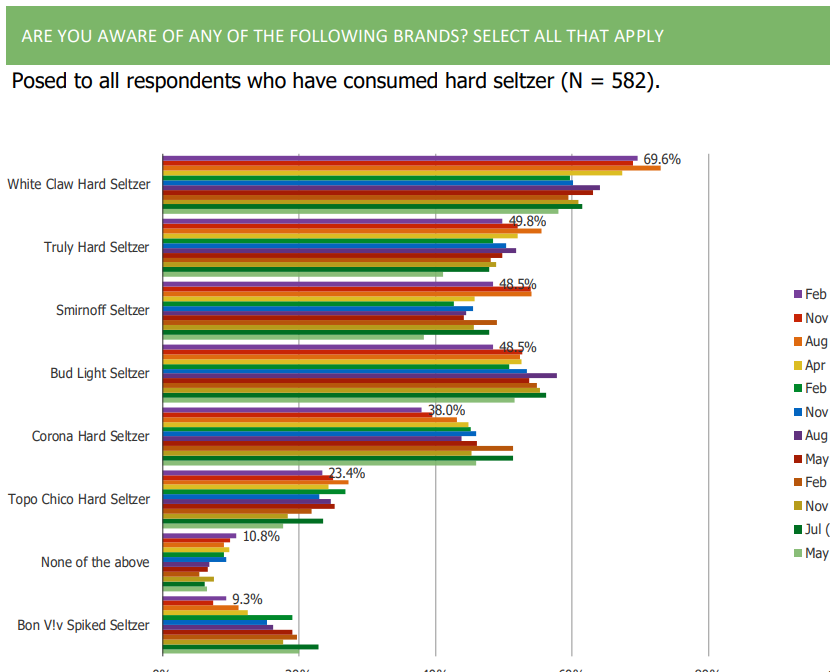
5. White Claw remains the most recognized hard seltzer brand.