Blog
Bespoke Survey Insights
GLP-1 Medications | Consumer Survey Preview
If you’ve paid any attention at all to the healthcare or consumer space over the past few months, then it’s safe to assume that you’ve been made aware of Ozempic and other GLP-1 medications by now. The diabetes drug has seen a dramatic uptick in popularity over the past few months due to the weight loss and impulse suppression effects that it has on its users. As the drug has skyrocketed in popularity, the investment community has taken notice, and rightfully so given the implications that a “miracle” weight loss drug could have on the market and society at large. Now, if you’re familiar with us, then you known that when the investment community takes interest in something like this, then we’re going to run a survey on it, and GLP-1s are no different. We recently launched two consumer surveys covering GLP-1 medications, including a 10,100N group custom deep-dive containing 662 active users. Since the group custom survey was proprietary, we are limited in how much of it we can share, but we wanted to flag a handful of charts from the 140+ pages of insights to socialize what we have with the investment community at large.
Awareness
Awareness of these drugs are highest amongst those with conditions such as diabetes, sleep apnea, and obesity. Respondents who stated that they have an interest in taking GLP-1 medications are more likely to be in the process of trying to lose weight than the average consumer. Among those who are not interested, top reasons include not being overweight/diabetic, being concerned with the side effects, and general skepticism about drugs.

Are GLP1s Actually Working?
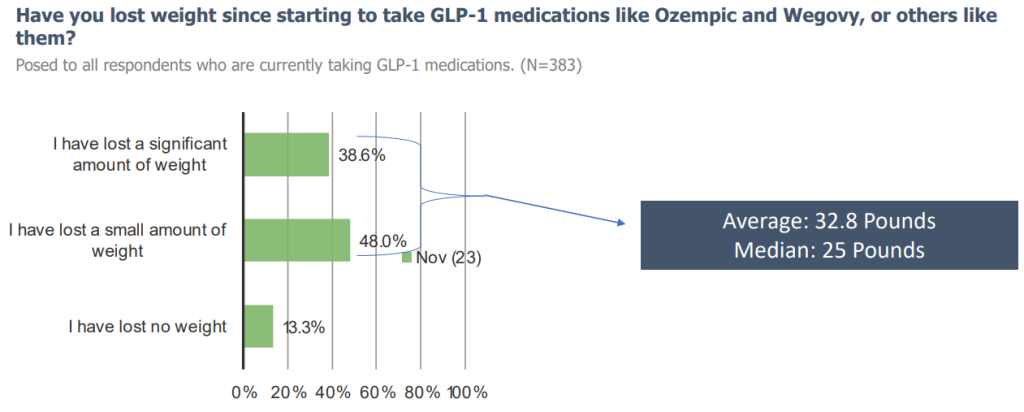
Consumers who reported that they are currently taking GLP-1s stated that they have lost weight since starting the drug, and a plurality of them mentioned being very satisfied with their experience thus far. Many have reported reductions in their calorie consumption since they started on the meds.

Where’s The Downside?
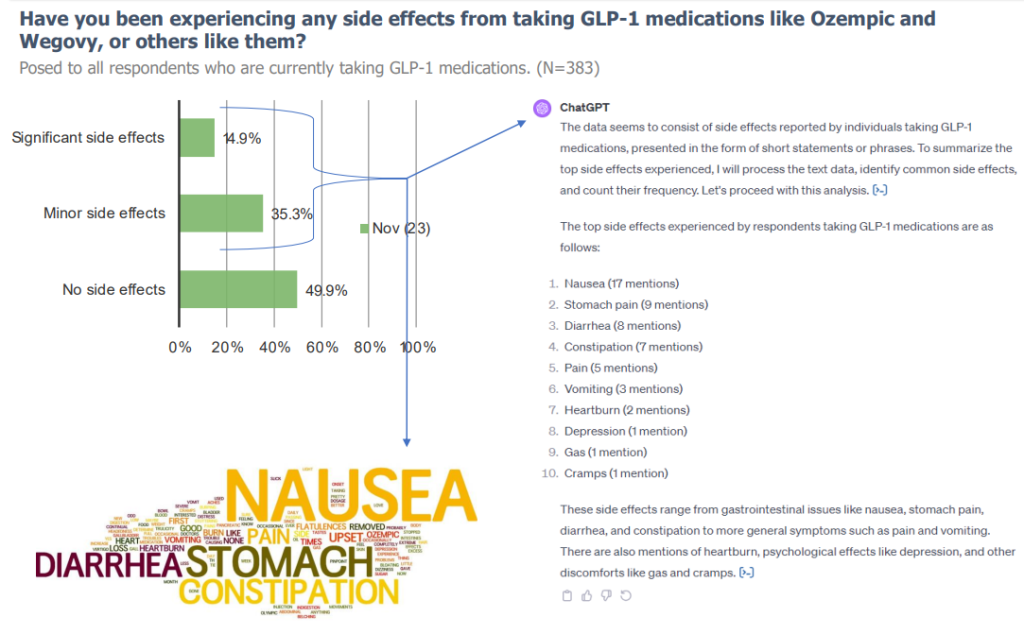
Half of respondents taking GLP-1s have reported experiencing side effects, most commonly nausea and stomach pain.
Show me an example of how GLP1s are impacting the health care space..
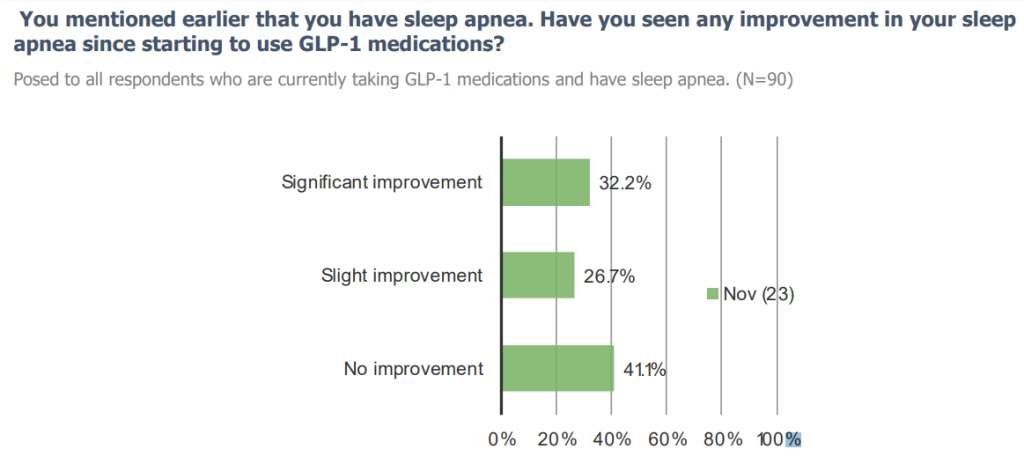
60% of GLP-1 users who have sleep apnea report improvements in their condition since starting GLP-1s, but the majority (95.6%) plan to continue their CPAP device usage going forward.

What about Consumer retail, give me an example of an impact there:
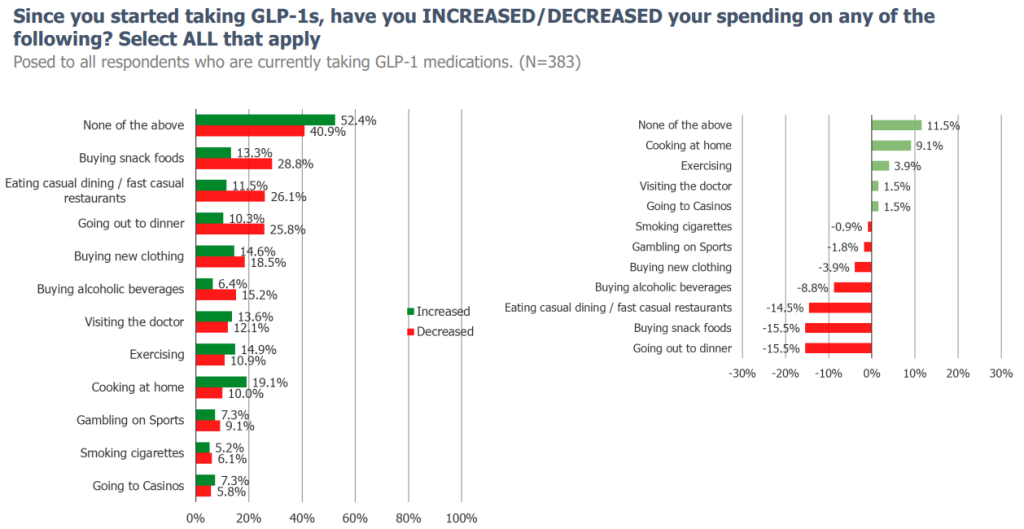
On the retail front, snack foods seem to have taken the biggest hit in terms of reductions of spending & consumption frequency because of GLP-1 usage. We found that ~37% of consumers who are currently on GLP-1’s have either slightly or significantly increased their consumption of snack foods in the past 12 months, while ~37% either slightly or significantly reduced their consumption habits.
This post is merely scratching the surface of the data that we have collected on GLP-1 medications. If you’d like to gain access to our GLP-1 reports, or want to hear more about our platform as a whole, please reach out to [email protected].
NFLX: Original or Not?
If you cover Netflix in any capacity, you’re probably aware that for the first time ever, the streaming giant released a report of it’s most watched titles through the first half of 2023. This move prompted us to brainstorm on how we could do some analysis of our own to determine what shows and movies Netflix subscribers are most recently engaged with. With the help of ChatGPT, we were able to analyze 32,000 survey responses from 40+ monthly waves of surveys along with a database of 3200+ titles of Netflix originals, to tell us what percentage of the last things watched by respondents each month were originals vs non-originals.
We found that historically, non-originals make up most of what consumers are watching on Netflix. Over the past few months however, there has been a fairly significant shift toward consumers watching more original content on the platform.

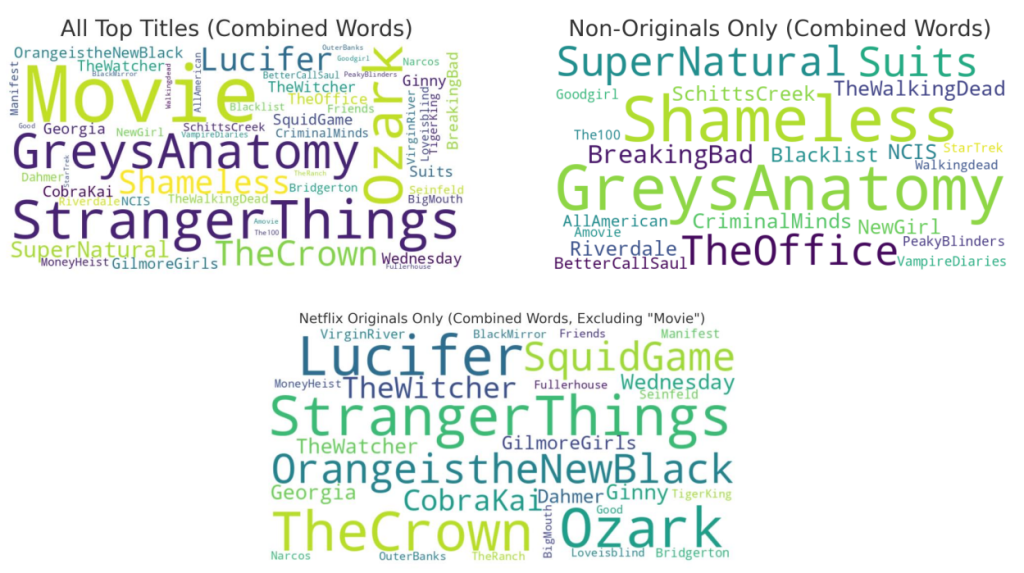
When we asked ChatGPT to list the top titles mentioned and then asked it to cross-reference the originals database to label each as either original or non-original, 7 out of the top 10 names listed were Netflix Originals, with Stranger Things far and away taking the top spot.

We then asked ChatGPT to create word clouds of titles by category across all 32k+ fill-ins.
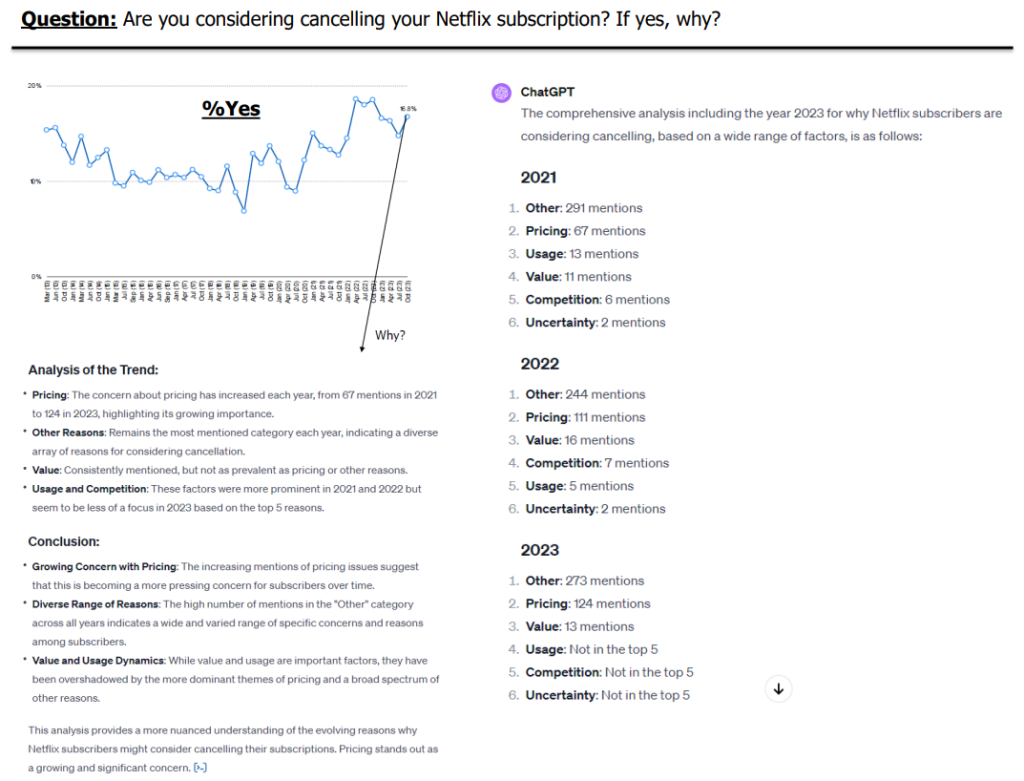
When asked if they were considering cancelling their Netflix subscriptions, 16.8% of respondents said yes, with pricing being their top concern. This concern with pricing has increased every year since we began asking this question, from 67 mentions in 2021 to 124 in 2023.
What’s in your wallet? Group Custom Survey
This week, we’ll be launching a survey focused on credit card trends, mobile payment apps, student loans, BNPL, and other topics.
We are using a combination of traditional survey methods and we are incorporating free form fill-in text to be analyzed for signal with ChatGPT.
If you have any interest in participating, please email [email protected].
ChatGPT: I’ll provide a concise overview of the survey questions
- Age of respondent
- Gender identification
- Household income range
- Employment status
- Change in annual household income
- Possession of an emergency fund
- Ability to cover unexpected expenses
- Living paycheck to paycheck status
- Confidence in spending on essentials and non-essentials
- Race/Ethnicity
- State of residence
- Credit score range
- Challenges with credit history
- Current loans/debts
- Priority of loan types
- Credit and debit card ownership
- Frequency of different payment methods
- Average monthly card spending
- Percentage of purchases on credit cards
- Handling of credit card debt
- Changes in credit card balance
- Preferred types of credit cards
- Importance of credit card features
- Recent research into credit/debit card offerings
- Understanding of point offerings with different brands
- Primary use of selected credit cards
- Student Loan Resumption – If they have been paying or not, how their spending has changed
TEMU Survey Data
Below are some year-in-review takeaways from our TEMU survey work. Our full report contains deep-diving competitive analysis with an array of retail and etail platforms and detailed identical item pricing analysis for Temu vs. Shein and AMZN. Start a trial with us today for more!
TEMU – A YEAR IN REVIEW
Awareness of Temu has increased considerably…

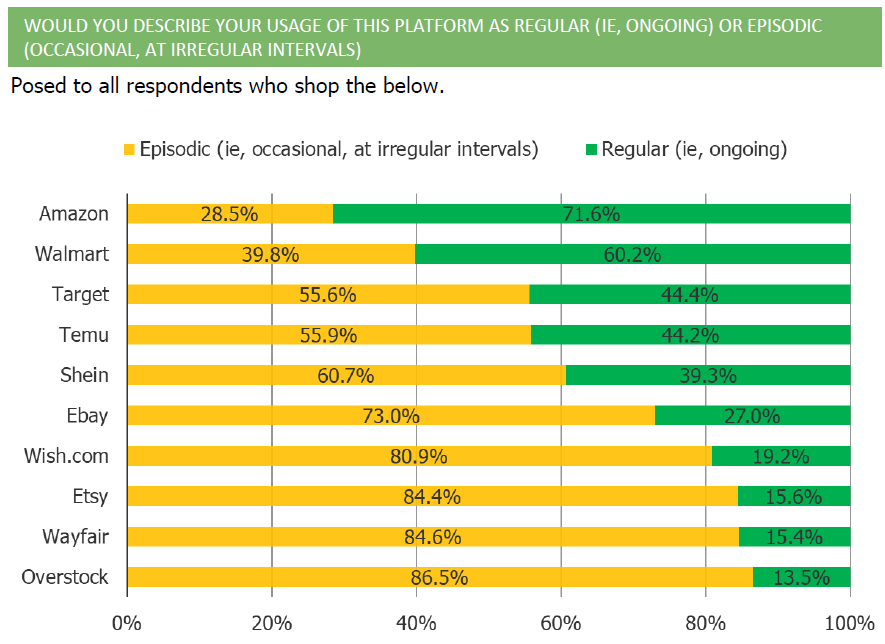
The share of consumers who shop Temu has increased, but October saw the first reduction in the share of consumers shopping Temu “regularly”

More people are shopping it, but among existing customers shopping frequency has pulled back some…

People who shop Temu seem to split immediately into categories of love it or hate it, based on their NPS readings…

Consumers use Temu for an array of product types, but clothing is number one…

Temu customers are more likely to use it for low cost items than high cost items…

Customers love it because it is cheap / has low prices…

But they complain about shipping times and quality…

Sentiment is generally positive, but has softened over time…

PTON: Fitness For All, or Some? Depends on Who You Ask…
Each quarter we run a survey tracking consumer trends within the fitness industry. In the latest wave of the survey, we did tons of deep-dive work on Peloton to better understand their customer demographics and how consumers view the company.
Of all of the fitness brands that we tested in the survey, Peloton was the most likely to be viewed as “more for wealthy consumers” as opposed to “accessible for all.” To add to this, there is a significant level of divergence in how Peloton is viewed by existing customers and how the broader pool of consumers view the company. Existing customers see Peloton as a high quality, luxury fitness brand while the majority of the broader consumer population sees it as just an expensive fitness trend. That being said, over the course of the survey there has been some degree of gradual decline in the share of consumers who view the company as a “luxury” brand.


The share of consumers who are aware of Peloton but do not own any products from them are more likely to view Peloton as an overall fitness and wellness company, as opposed to just a fitness bike company. Among consumers that do not currently own any Peloton equipment but are considering buying some, an increasing share expressed interest in purchasing the bike while a declining share expressed interest in the tread. Overall fitness product interest is on the upswing after reaching a series low in October of 2022. The data isn’t where it was during Covid, but has improved relative to recent history.

Back in May, Peloton announced a brand relaunch that included revamping their app by adding a tiered subscription feature. Peloton encouraged people to use the app even if they did not own Peloton products, so we asked consumers how interested they’d be in using the Peloton app without owning any of the equipment. We set a baseline level of interest in the share of non-Peloton equipment owners and found that around 15% of these respondents would either be “interested” or “very interested” in using the app despite not owning any equipment. Of the cohort of consumers that does own Peloton equipment, the share of them that only use the Peloton app has increased in recent quarters.

Instacart IPO Primer
On Tuesday, September 19 2023, Instacart became the first venture-backed tech company to IPO since 2021. The stock opened trading at $42 a share, 40% higher than $30 a share which was initially anticipated and closed out its first day of trading at $33.70 a share. Investor sentiment has been wary as market conditions have not been ideal for growth-heavy tech companies.
Here at Bespoke, we published a survey and did some cross-tab work on CART consumers to see how the grocery delivery service is viewed through the lens of a customer. Sharing some key takeaways below..
Findings:
- Instacart usage surged higher during the pandemic. Since peak engagement , the share of respondents who use the service on a regular basis has regressed back to pre-covid levels. The share of consumers who state that they use it on an occasional basis, similarly surged higher during the pandemic, but has held more or less steady since.
- Overall awareness of Instacart has increased considerably since January of 2018
- Instacart users have been less likely to order from Amazon Prime since the beginning of 2022 (monthly usage of Instacart has increased slowly over time). That said, the share of Instacart users who did not have groceries delivered at any point in the past month has increased during the same time period.
- During the pandemic, Instacart user demographics shifted towards being more male than female and older cohorts adopted usage in a major way, as did higher income bands.
Excerpt of Charts:


Social Media Dynamics
Every quarter, we launch a survey covering social media names as a means to track consumer sentiment. Back in July we published the 40th volume of the survey. We aimed to understand specific trends within the space and had numerous questions relating to usage of Instagram Threads. Let’s dive in…
Threads insights:
- Relative to other social media platforms, Threads users are more likely to skew male, skew younger, and skew liberal (political affiliation)
- Among the base of users who have downloaded it, feedback has come back generally positive
- NPS among those who have downloaded Threads came back at 30, a high score but from our experience, lower than what is expected from a new platform.

Social Media Sector and App Specific Trends:
- Consumer trust in social media platforms has improved sequentially and self-reported engagement with social media apps is improving

- Concerns about privacy issues continue to subside. Awareness is there, nut each quarter there is less concern

- Consumers offer increasingly positive sentiment toward buying products through social platforms

- Twitter user have a net favorable view of Elon Musk owning the platform

- Instagram Reels feedback has improved sequentially
An Update on Carvana..
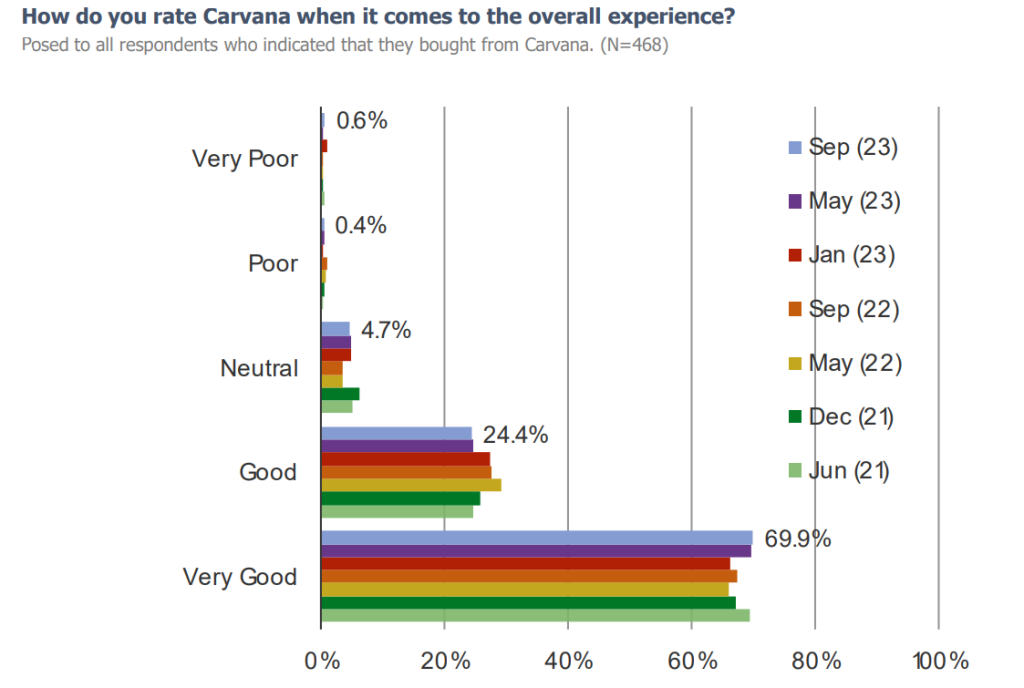
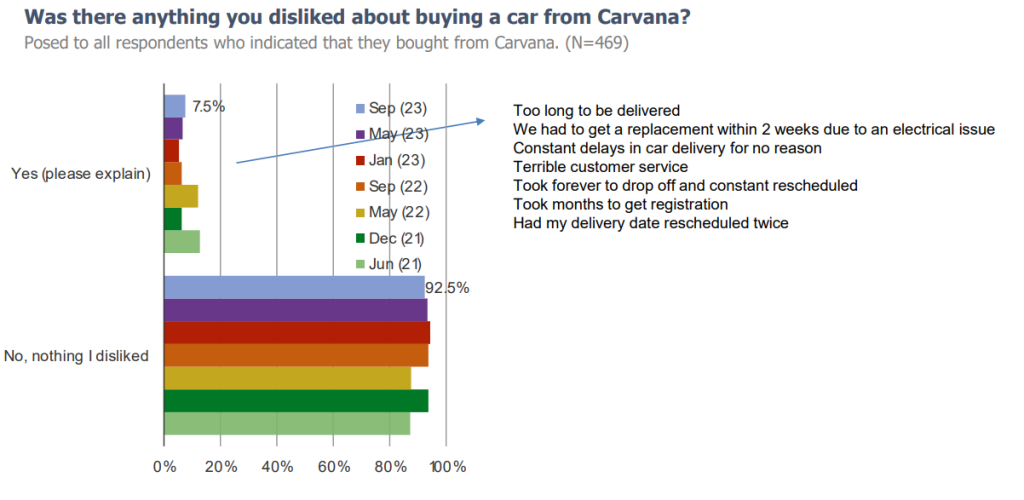
Back in January, we published an article on Carvana named “Is Carvana Over? The Consumer Angle.” At the time the stock was trading at around $4.20 per share and there was serious concern that the company would have to file for bankruptcy. Since the time we published that article, Carvana’s stock rose to a high of $57.19 and is currently trading at around $47 per share. In the article we chose to take a different perspective from what we were seeing from the financial community at the time, and decided to deep dive into how customers actually felt about the company. We’ve continued to track consumer sentiment toward Carvana throughout the year by means of a 10,000N survey that we refresh quarterly, and if there’s one thing that we’ve come to realize, it’s that consumers really enjoy the Carvana experience.
This is not to say that we were “right” or that the company no longer faces the headwinds that it did in January (i.e. threat of bankruptcy, problems with unit economics, etc.), it’s simply a way of showing how the use of surveys to track consumer demand can provide a differentiated perspective on a company.
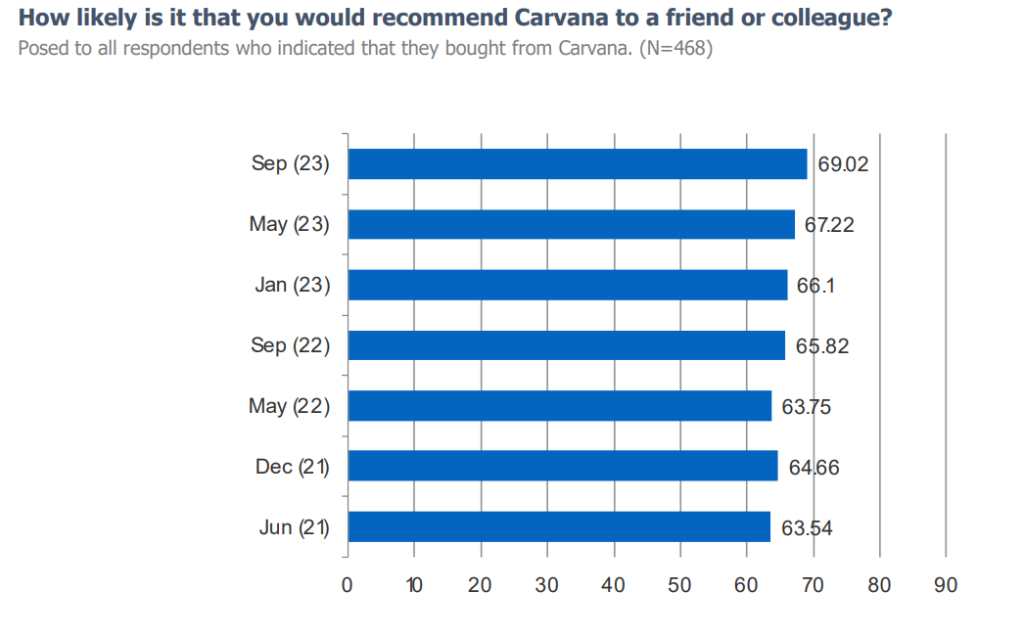
We published the latest refresh of the survey last week and consumers felt more or less the same as they had in January about their experiences using the online auto retailer. When it comes to competitive dynamics, Carvana ranked near or at the top in terms of things like pricing, selection, and overall trust, NPS for selling a car to CVNA has improved since January and currently sits at 58, which is a very strong score. NPS from those who bought from Carvana also improved and currently sits at a series high of 69.
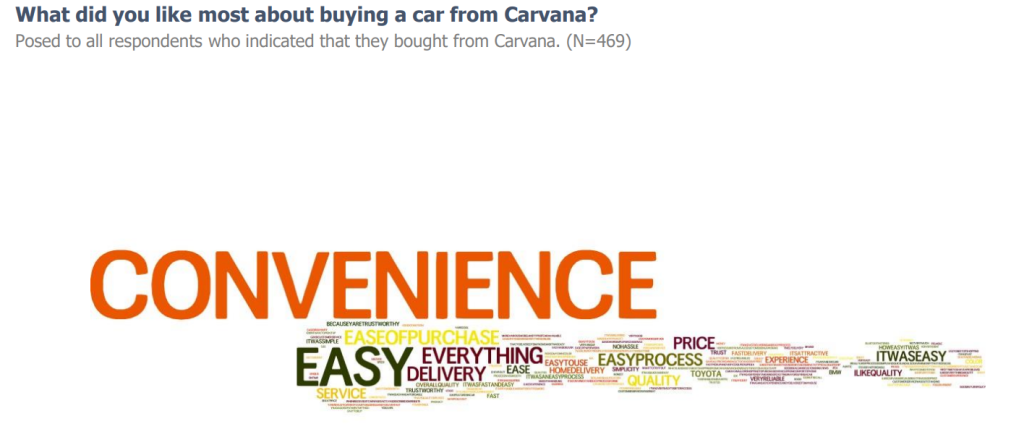
Customers stated that the convenience of Carvana is what they enjoy the most about purchasing a car from them. Since the early waves of this survey, Carvana customers have grown less and less likely to visit a dealership before buying from Carvana. Customers firmly believe that Carvana is a better experience than a dealership, and indicate a high likelihood of shopping for a car there again in the future.
Simply put, customers that use Carvana love the experience and consumer adoption of buying used cars online are still in the early innings.
Excerpt of Charts:

Student Loans & Discretionary Spending
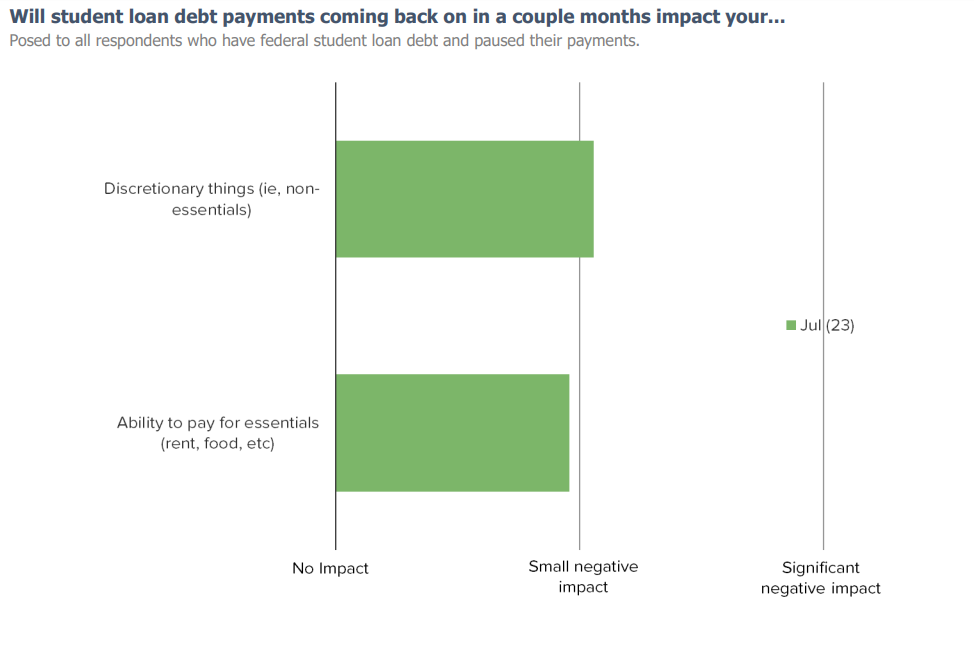
With student loan repayments set to resume in October, there have been questions as to how individuals that are straddled with student debt will react to having to pay off their loans every month. How will discretionary spending change as they resume? What industries will be affected the most? We ran a survey on US Consumers to dig deeper on this.
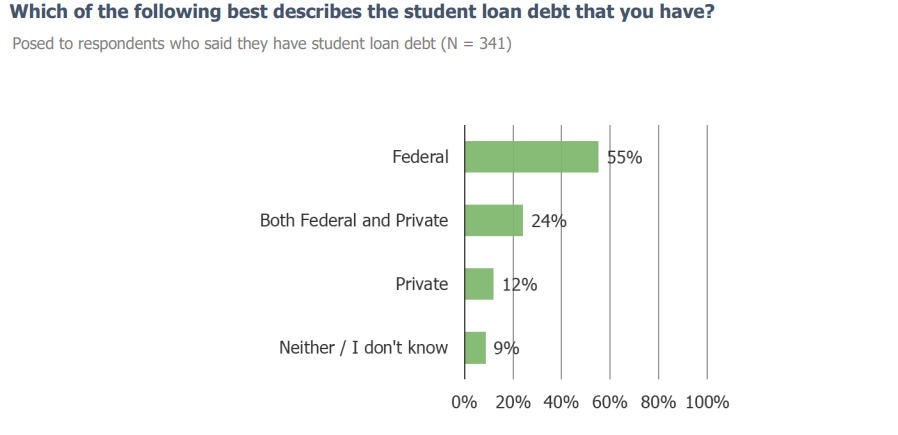
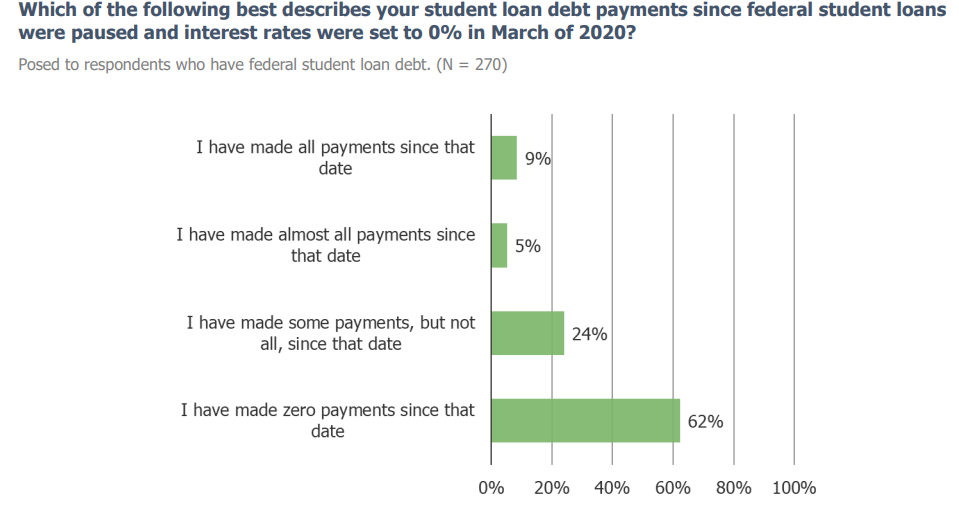
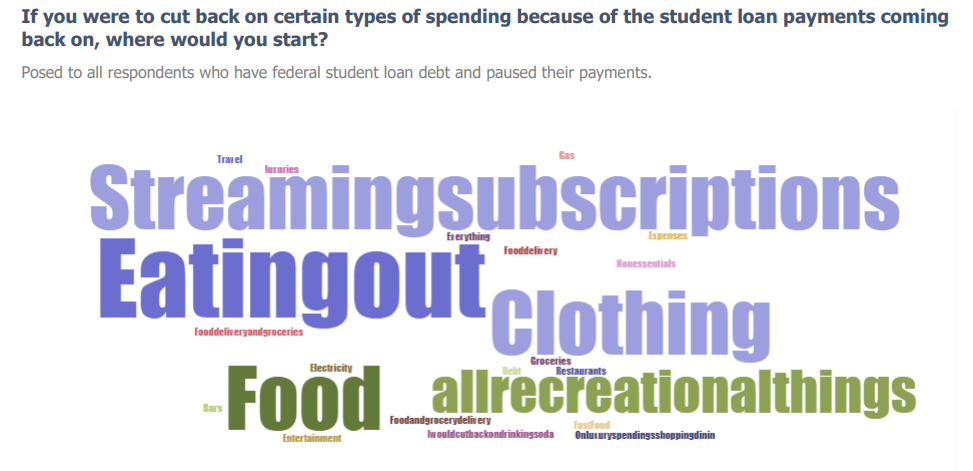
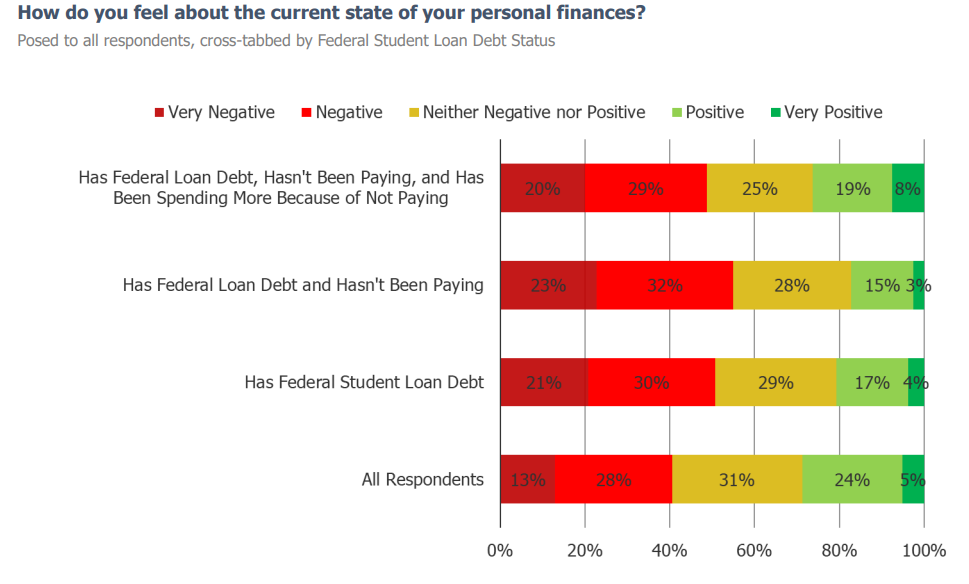
Since the pause on student loan repayments was enacted, a large portion of individuals with loans say that they have not made any payments during the period. 34% of the respondents who paused their federal loan payments said that they increased their discretionary spending because of it. We cross-tabbed our responses by age and found that an overwhelming portion of those who have been spending more, are likely to fall within younger age cohorts (recent university graduates). Of these respondents that paused their payments, a large portion stated that they would have to cut back on their discretionary spending once they resume. The top things that these respondents called out as something they would cut back on include eating out/food, clothing, and streaming subscriptions. Respondents who increased their spending during the pause period have a generally more optimistic view on their personal finances than those who paused their payments and did not increase spending.
We have a number of consumer spending categories throughout the report that show consumer activity by their status with federal student loan payments. We currently have another survey on student loan debt with a much larger N size that we’ll be launching at the end of this week as well. This is a topic we’ll be looking to track a lot more going forward as the pause comes to an end, so if you have any interest in gaining access to our most recent report or any of our future reports, please let us know. Sharing some relevant color below.
Start a trial with us today to get plugged into upcoming results…
Wayfair vs. Amazon: Pricing Wars
Of all of the eCommerce platforms that we run survey and pricing analysis on, Wayfair continues to show up as one that consumers are more likely to shop at episodically. A large plurality of Wayfair customers stated that they primarily purchase goods from the website when they’re moving or looking to move. This poses the question as to whether or not Wayfair will struggle in the midst of a potential housing crisis. As mortgage rates continue to climb and seize up the housing market, there’s real worry for a company that relies so heavily on selling into a demographic of consumers on the move.
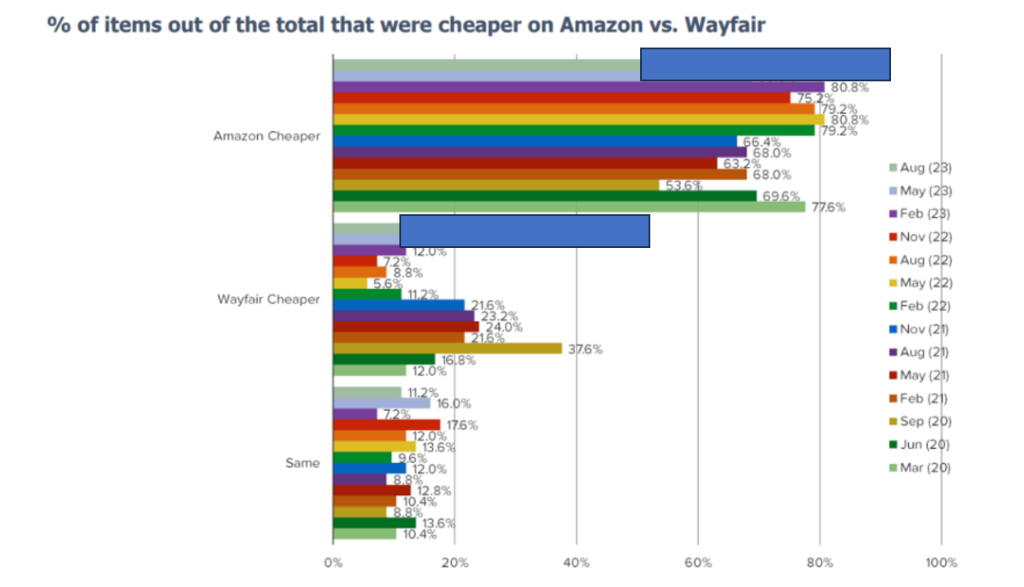
Our latest report is a pricing analysis that compares the cost of identical goods visually matched on both Wayfair and Amazon. We’ve run this analysis over the past 14 quarters and this particular quarter shows an interesting inflection in the data given the current backdrop.
Sharing some sample data below. Start a free trial today to access the readings from August and May of 2023.
BBWI | In-Store Experience in a World Shifting Online
Consumer opinions of BBWI have typically been relatively positive in our survey. The customer base has been with the brand for a while and it has strong unaided and aided awareness across multiple categories. In the past year, NPS has pulled back a touch, but in all, consumers really like the retailer.
One thing we are constantly on the lookout for when we analyze survey results across hundreds of companies that we cover is when one of them seems to buck a trend we are seeing elsewhere. It is no secret that online shopping engagement has increased in many sectors. It is usually either the preference of consumers or it has at least been gaining share as the preferred method of shopping.
What sticks out to us about BBWI is the degree to which customers prefer to shop it in-stores, as opposed to online. Not only is the degree of in-store preference stronger than most other retailers we run surveys on, that preference actually increased over the past 12 months.
BBWI is a name that we’ve noticed increasing interest in lately from the buyside. If you’d be interested to learn more about the name via our survey, request a trial below.


TEMU is Hungry
If you cover consumer in any way shape or form and don’t know about Temu, what kind of rock have you been living under?
We first heard of Temu late last year. We didn’t know much about it at the start – just that it was a really fast growing app and that the investment community was starting to notice. Earlier in the year when buyside folks would talk to us about the work we were doing and we mentioned Temu, most of them had never heard of it. Then a couple weeks later they’d circle back telling us that they were noticing the app more and more. Now, Temu is one of the topics we get asked about most often when folks are looking for survey data from us.
The charts below offer some color from our latest survey work on Temu, but it is only a small part of what we have…
Request a free trial today to see competitive analysis on which peers Temu is impacting the most, to see cohort level data, and much more…


