Blog
Bespoke Survey Insights
Buyside Analysts Are Not Normal
We’ve all seen or heard the saying a number of times in investing circles… something to the effect of, if you are right and everyone else is wrong, it really doesn’t matter that you are right until eventually everyone else realizes it. If that moment doesn’t come, you can be logically right about something but wrong on paper when it comes to the P&L behind the idea. And tragically, the crowd has proven that it can go along being wrong for quite a while (even indefinitely).
If there is one thing we’ve learned after helping buyside analysts and PMs for 10+ years now, it is that they are very far from your average consumer. The average consumer can be messy – not always incredibly logical, sometimes reactionary and overly emotional, short-sighted, and sometimes uniformed or impulsive. Hedge fund analysts tend to be more analytical, disciplined, logical, and methodical. Stop me if you can see where we are going here, but there can be a disconnect between how a hedge fund analyst and the average consumer thinks and oftentimes you can park more than a truck between them. The trouble is that the sentiments and behaviors of the average consumer often underpin buyside investment theses, and you can’t bend them to your will with logic.
Every line item in a model is laboriously toiled over and countless dollars are spent on external data to gain marginal improvement in precision. Those data inputs are viewed as “need to have” because you can mathematically calculate the ROI of having that data in a post mortem analysis/backtest. If you move further toward the beginning of the idea funnel – it is harder to mathematically calculate an ROI on the inputs you use to generate ideas and to create a foundation of knowledge that will impact every assumption in your model.
Focusing on the idea gen, thesis support, and knowledge foundation – we believe there is opportunity both in the under-investment in data for that part of the funnel and in the disconnect between how institutional investors think and how the average consumer thinks.
The net/net of all of this, is that if you are investor you should consume more survey data and run more of your own custom surveys.
Request a trial to explore our library of surveys or contact us if you have any custom survey needs ([email protected])… you’ll be hard pressed to find a larger library of buyside generated surveys out there or a vendor that will get you high quality data at a faster speed.
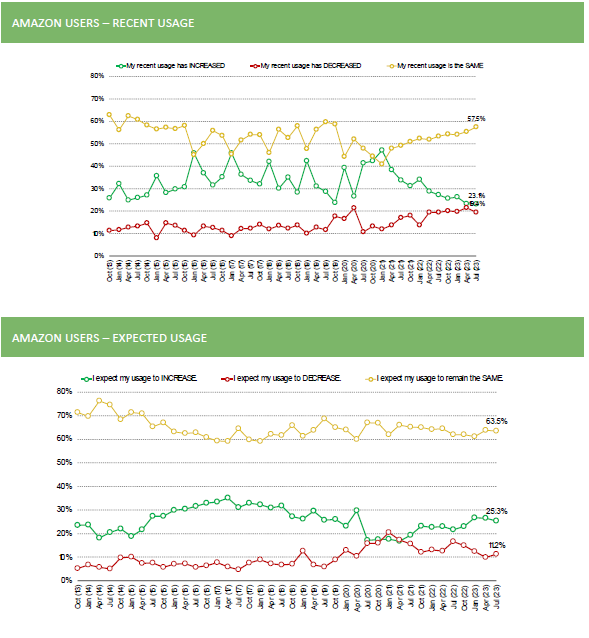
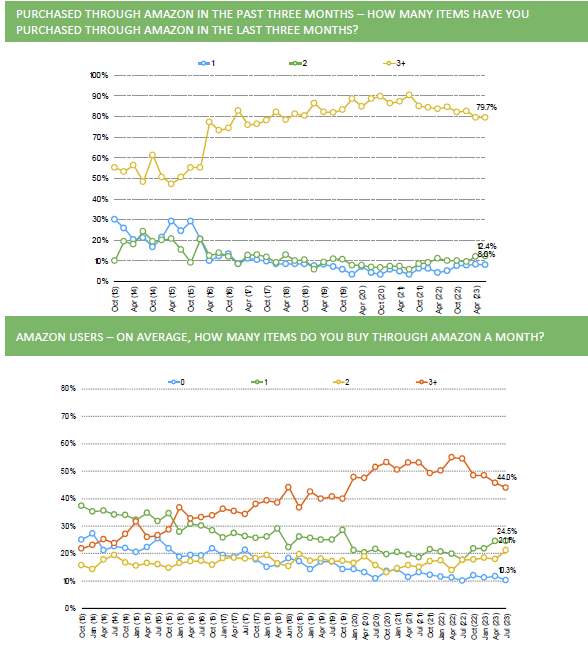
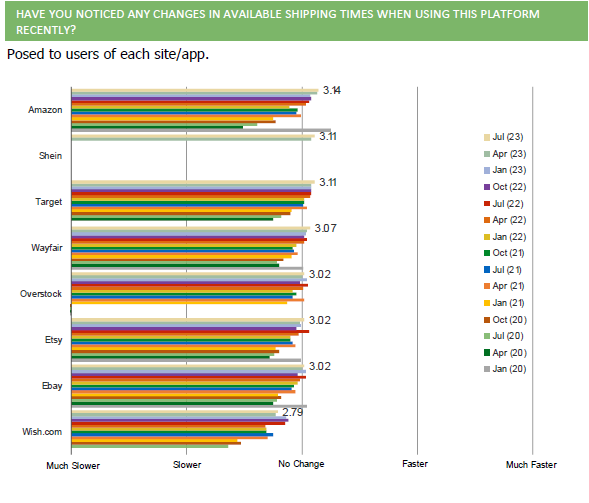
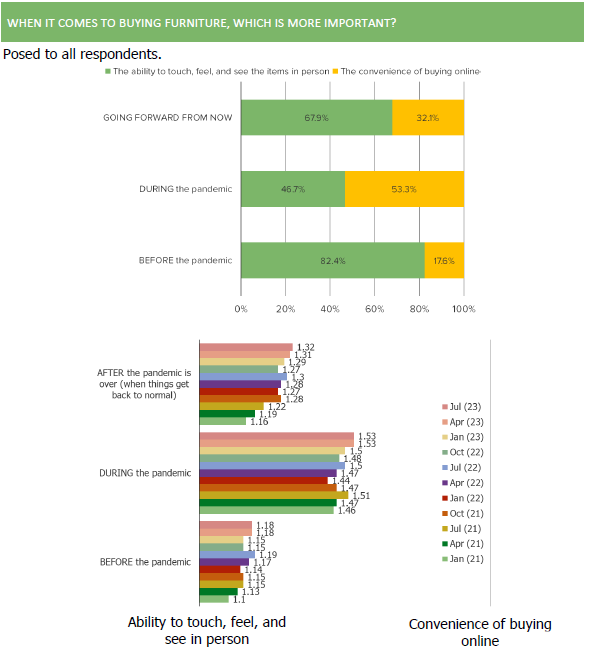
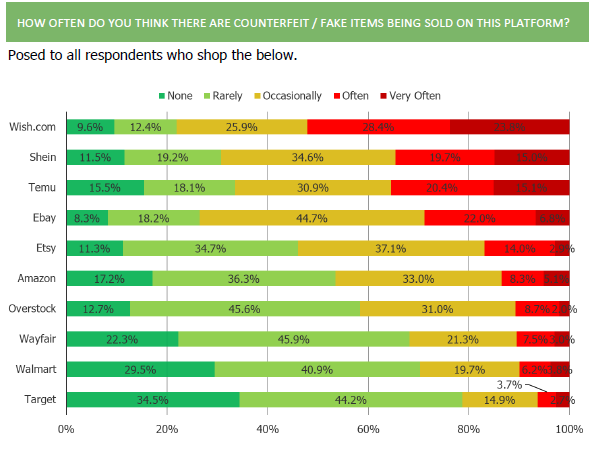
(AMZN, ETSY, W, EBAY, OSTK) eCommerce Survey | Preview
Survey Audience: 1,000+ US Consumers Per Wave, Balanced to Census
History: 42nd Quarterly Volume (90 Slides)
Tickers Covered: AMZN, ETSY, W, EBAY, OSTK, WMT, TGT, Temu, Shein, Wish
Access: If you are a client, login to view the full report.
If you are not a client and are interested, request access here.
KPIs Covered:
- AMZN Prime | Did former subs find it difficult to cancel? What % of them were unintentionally signed up for Prime.
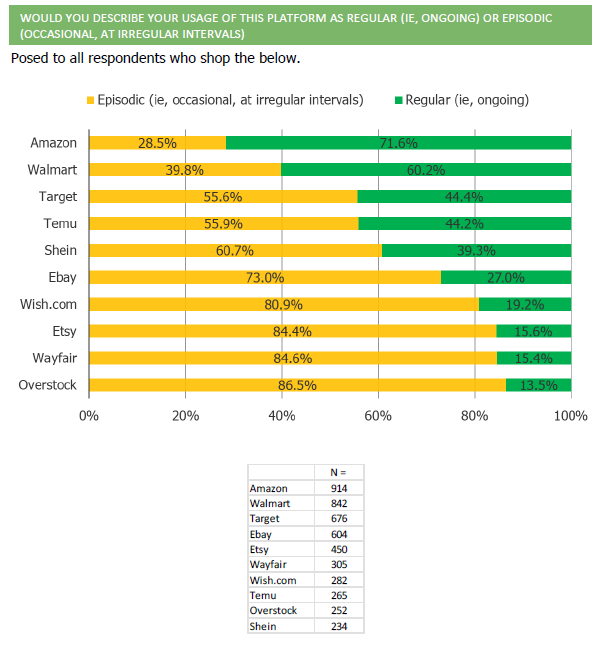
- All Platforms | Do customers shop regularly or episodically/irregularly?
- All Platforms | Episodic Shoppers – what is the catalyst that brings you to shopping the platform episodically?
- ETSY | How much does it matter to customers that they are shopping small business?
- ETSY | How do customers most commonly find themselves shopping Etsy?
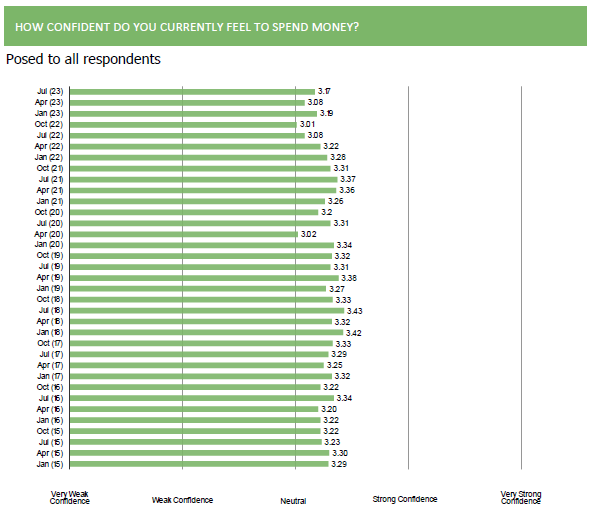
- Consumer spending confidence.
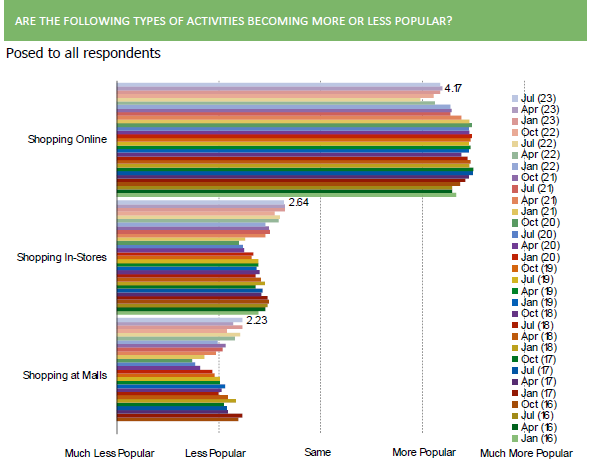
- Popularity of shopping online, vs. in-stores, vs. at malls.
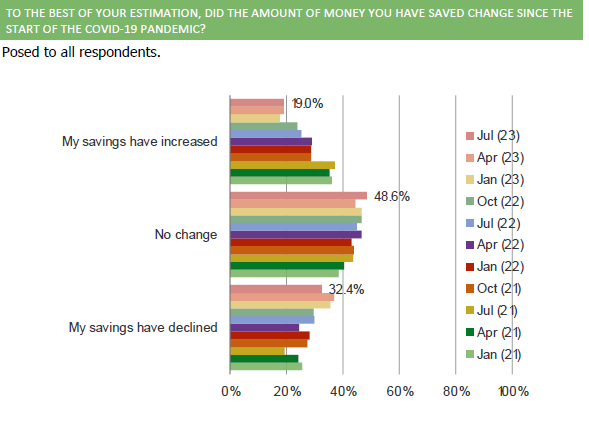
- Savings increased/decreased since Covid tracker.
- Impact on spending if respondents lose job / income declines.
- All Platforms | Perceived changes to sales/promo offers.
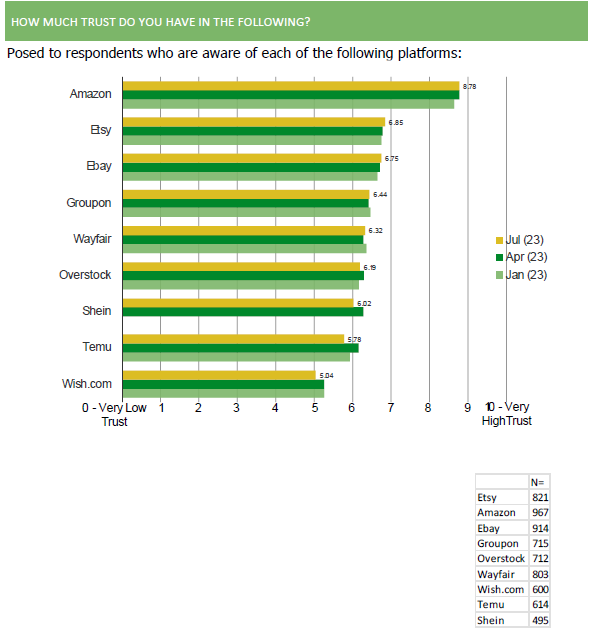
- All Platforms | Consumer trust.
- All Platforms | Customer loyalty.
- Furniture Purchasing | In-store vs. Online (pre / during / post Covid).
- Face mask demand trends.
- All Platforms | Shipping time feedback.
- AMZN / ETSY / W | Shopping engagement, number of items bought per month, mobile purchases, recent shopping feedback, expected shopping feedback, etc.
- W | Share of furniture items purchased from Wayfair, cross-shopping with Amazon for identical items, sentiment toward Amazon vs. Wayfair on pricing, selection, and visualization, comparing Wayfair to other online/in-person shopping experiences.
- All Platforms | Credit scores of each customer base.
Excerpt of Charts:
DPZ – Customers Will Still Prefer Domino’s Delivery
We just got back results from the 16th volume of our DPZ customer survey. If you are a client, head over to our portal to view the full report.
If you are not a client and would like to request access, please email [email protected].
Highlighting a Takeaway From Volume 16
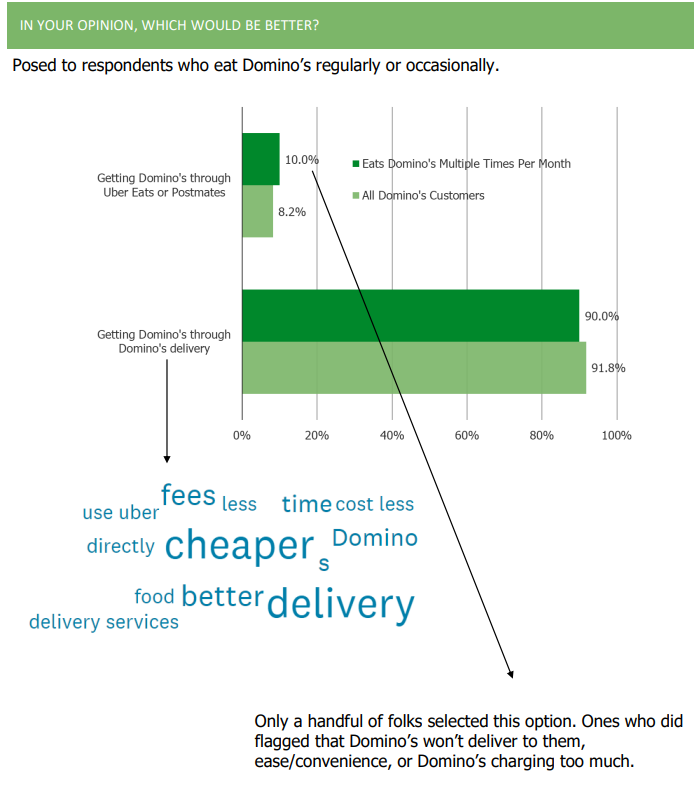
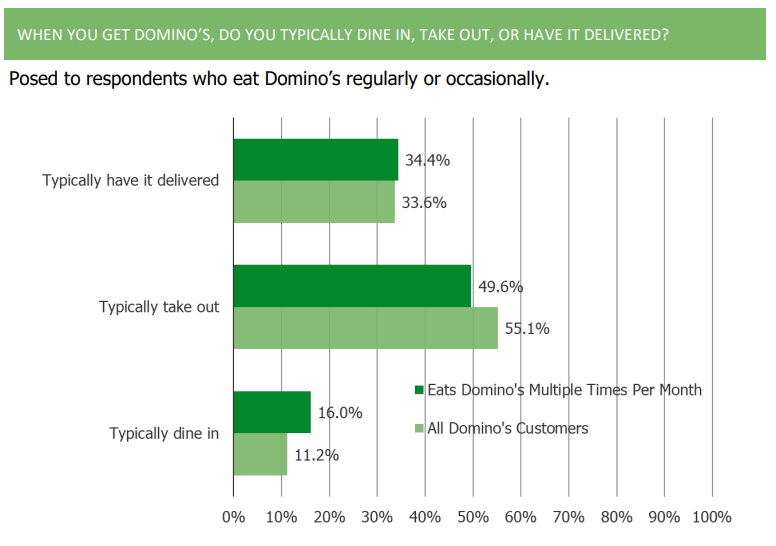
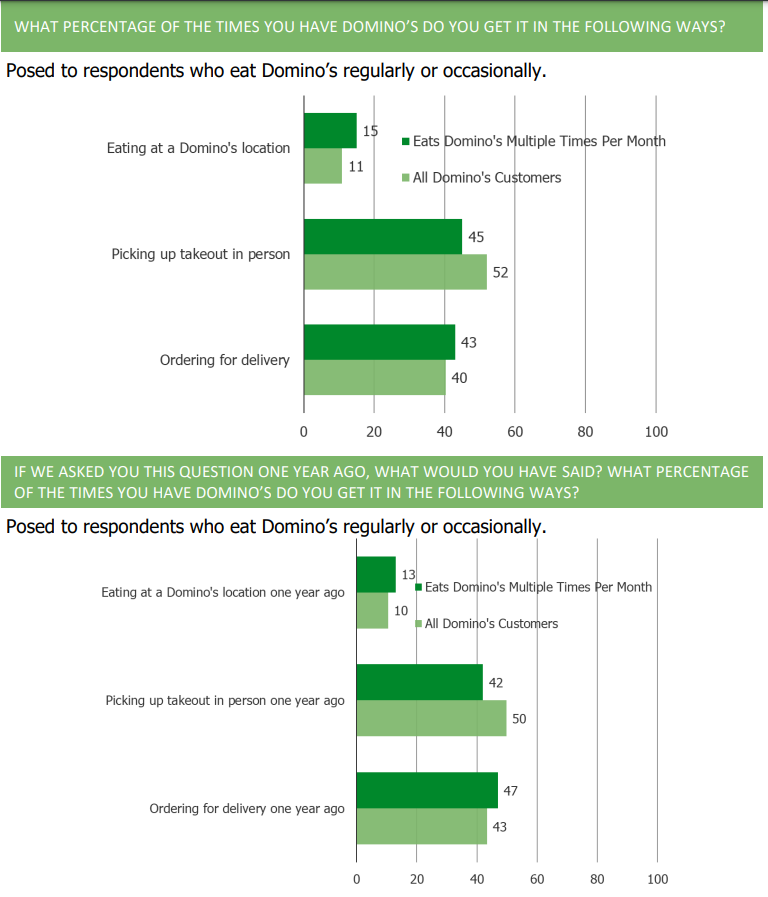
Domino’s struck a deal recently for distribution through Uber Eats and Postmates in the coming months. The vast majority of customers would stick with Domino’s delivery even after it becomes available on Uber Eats and Postmates.
We have quite a bit more analysis in the report about the upcoming change and a host of other KPIs that we track on DPZ.
Tesla Survey Data – More for the brand/tech
If you are a client, login to our portal to view the full report. If your not a client and would like to request access, please email [email protected].
Key Takeaways:
Autos and EVs
- Self-reported auto purchase activity has softened a bit sequentially.
- We have seen declines in those in the market to buy a car in the next 6 months who would choose luxury brands (non-luxury brands have received more consistent feedback). An increasing percentage of consumers (relative to February 2023) are saying that they think the vehicle they own is worth less than the amount they still owe on the car.
- Consumers have been stubborn to shift their thinking on the safety of autonomous vehicles. Over the entire history of our survey, they have viewed humans driving themselves as safer.
Tesla
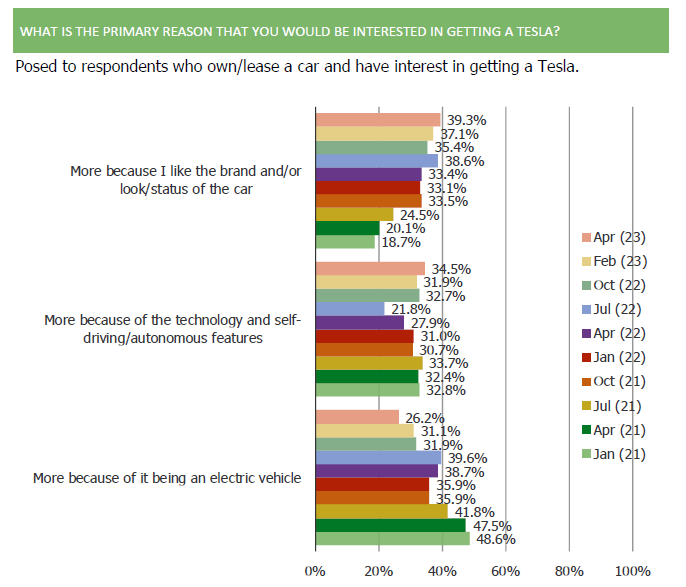
- The share of those interested in getting a Tesla who want it because it is an EV has declined over time. These folks have been increasingly likely to say they are interested in Tesla purely because of the brand and/or look/status of the car or because of the technology / self-driving features.
- The price cuts from Tesla continue to have a positive impact on consumer opinion toward the brand, but interest in getting a Tesla is softer now than it has been in prior waves of this survey.
Sample Chart From Full Report:
Consumers who are interested in Tesla are increasingly more interested because of the brand/technology, and less because it is an EV.

(META, SNAP, PINS, GOOG) Social Media Consumers Survey Excerpt, Volume 40
Request Access
To request access or for more information about the full report (112 slides full of charts) email: [email protected] or [email protected]. If you are a client, log-in to view the full report.
Key Takeaways:
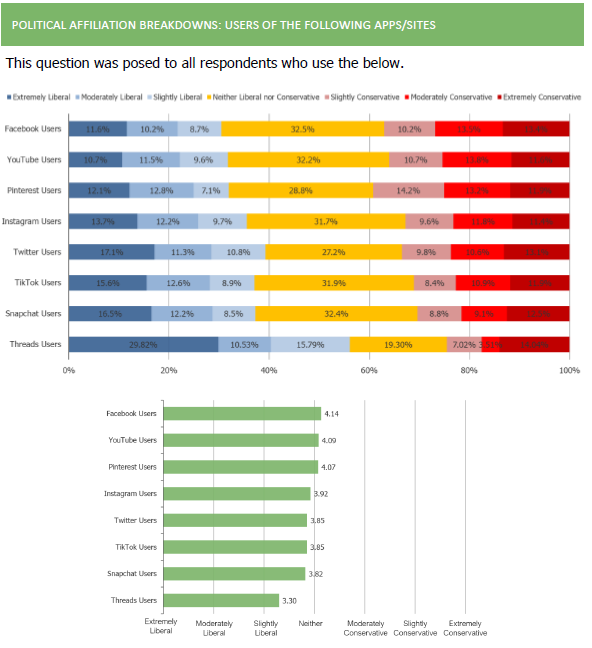
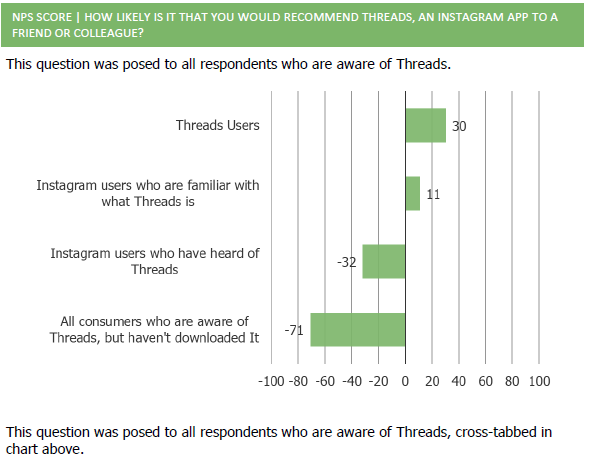
Threads
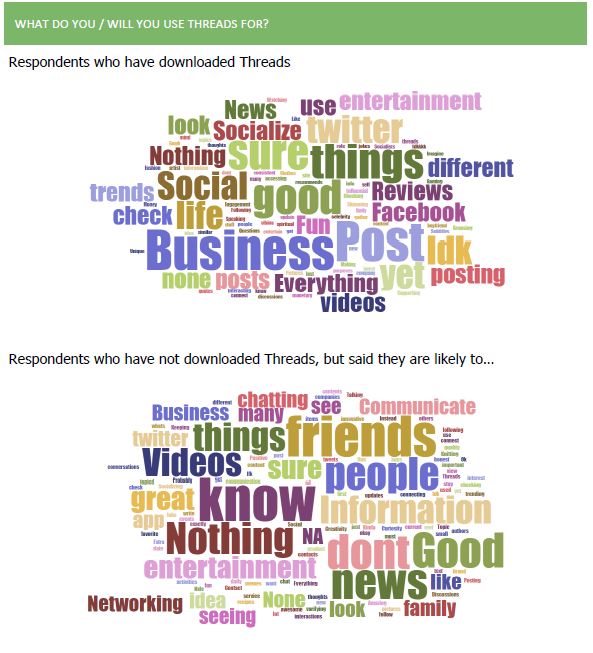
- Initial pop of downloads and awareness is high.
- People who have downloaded it give it a positive rating.
- But NPS is middling for such a new platform.
Social Platforms:
- Concerns about privacy issues continue to subside.
- Interest in being verified on social media increased q/q.
- Reels engagement feedback improved again.
- After a prolonged period of slow softening, sentiment toward Facebook has been improving this year (toward the platform overall, and specifically toward ads).
- Snapchat users have been shifting more toward messaging and away from stories.
- Twitter users have a net favorable opinion of Elon Musk owning Twitter.
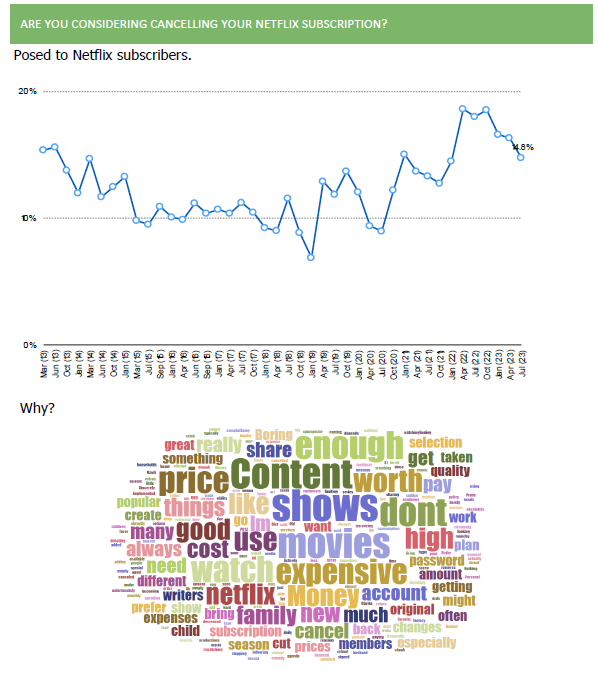
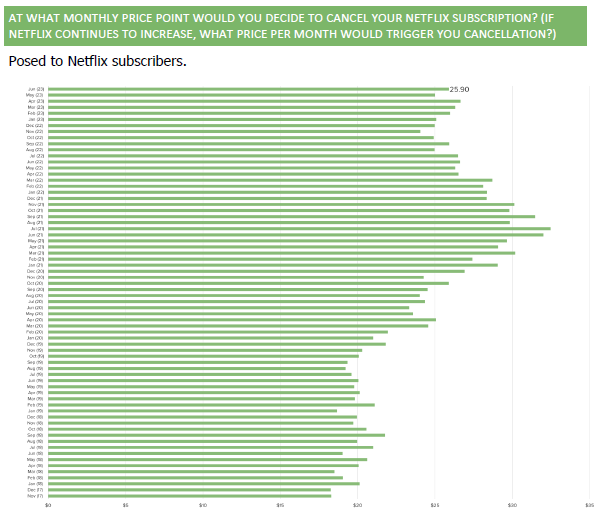
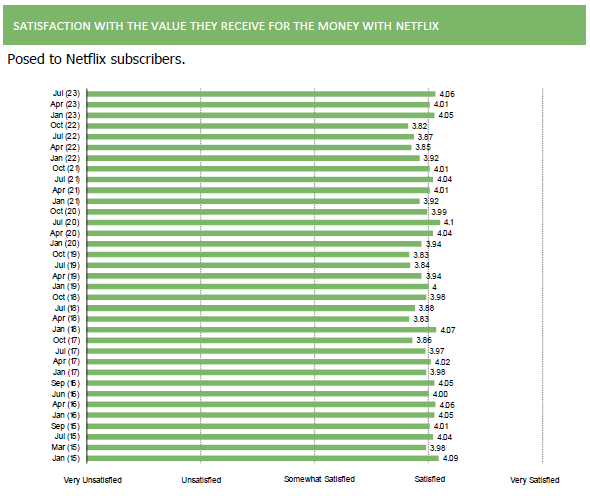
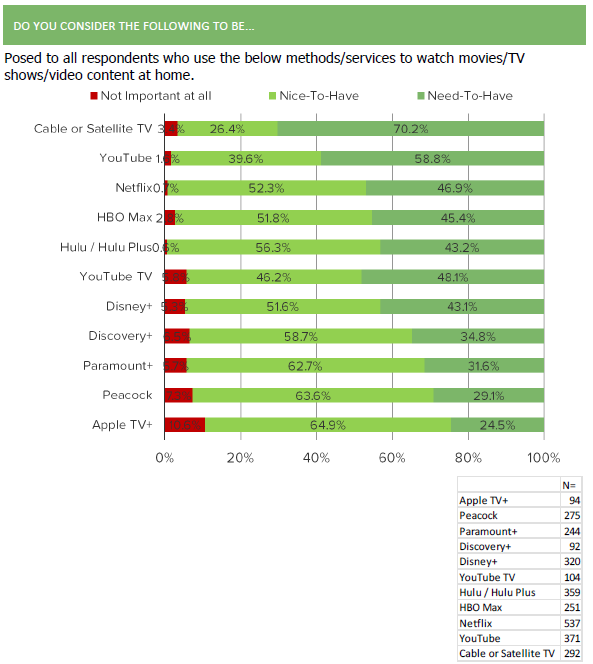
NFLX Survey | Positive Trends
Headline Takeaways:
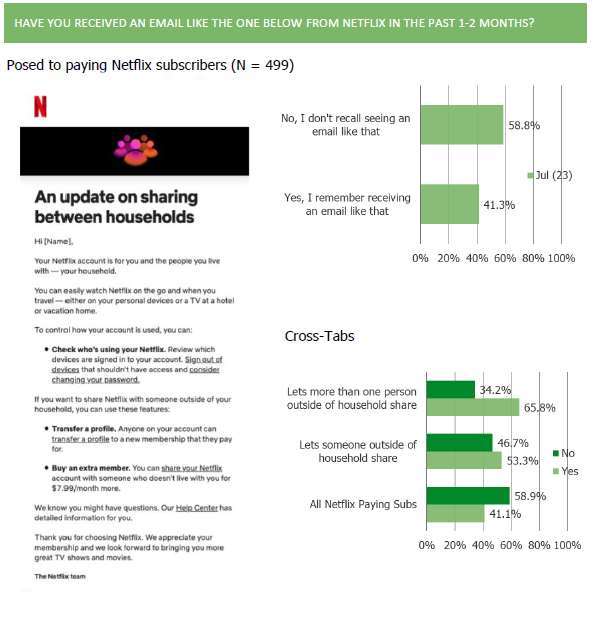
- Generally +ve streaming sector trends.
- Streaming continues to gain as the preferred method for consuming video content.
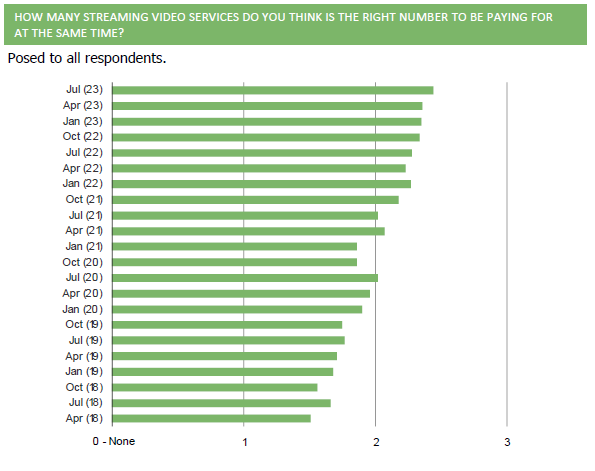
- The number of streaming video services that consumers think is appropriate to sign up for at a given time has increased.
- But, the average amount respondents think they should spend on streaming video platforms at a given time has been flat for 1-2 years.
- Netflix Trends – Mostly Positive
- Respondent sentiment is strong / improved.
- Pricing / value feedback improved sequentially. Pricing power improved sequentially and perception of value improved.
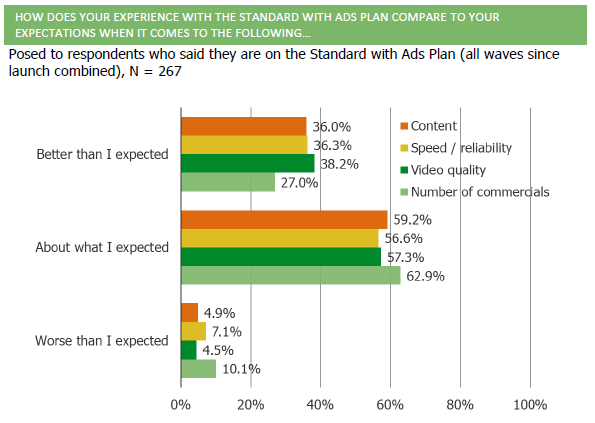
- Standard with Ads feedback remains positive (better than consumers expected, price point on the money, ad-load expectations remain consistent).
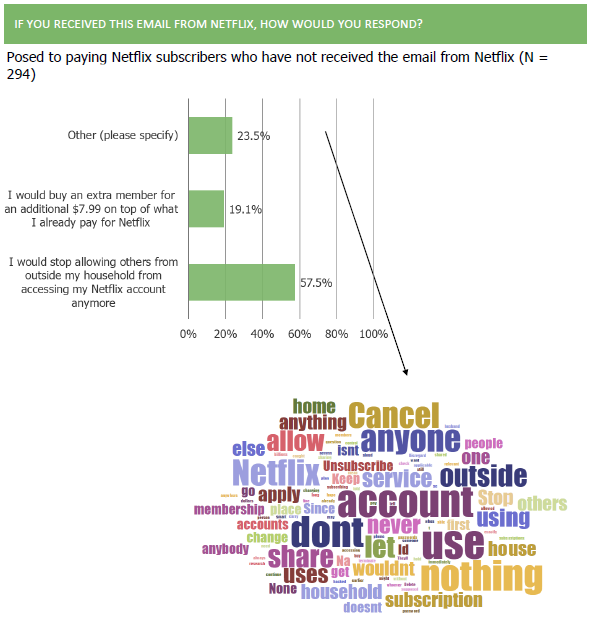
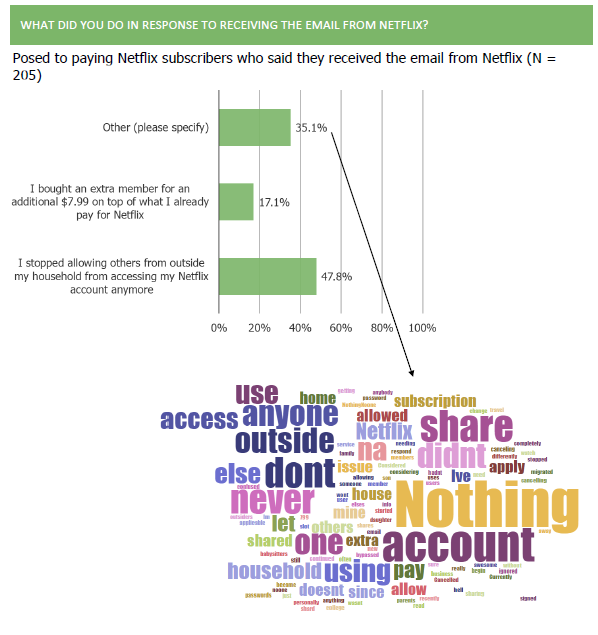
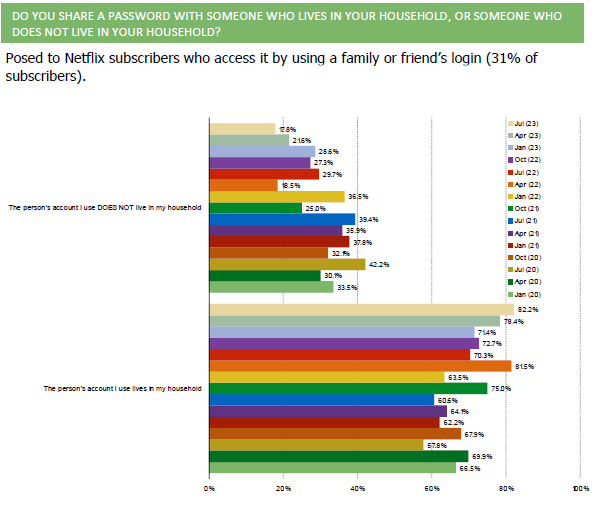
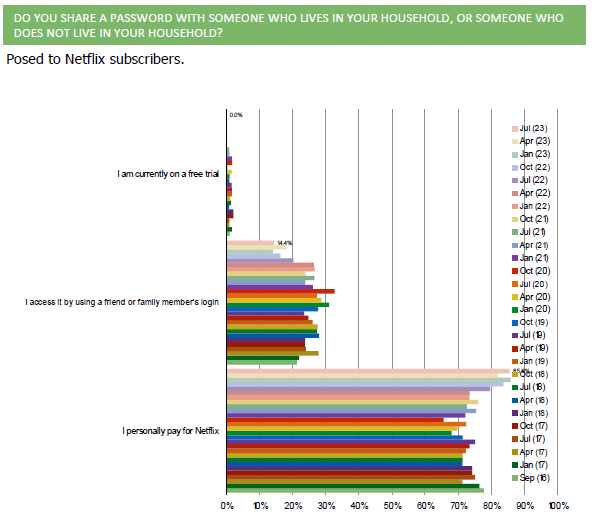
- Account sharing has declined. Sharers flag that they have seen account sharing emails from Netflix.
- Competition is increasingly viewed as incremental, not replacement.
- Churn expectations declined again sequentially.
- Cable TV Personalities – New Questions This Quarter
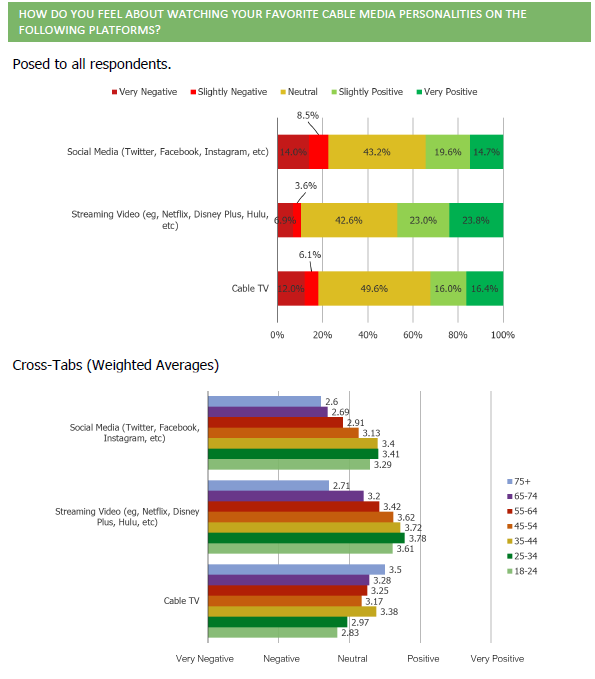
- We added some survey question this quarter to understand how important cable news personalities and live sports are to consumers. We found that there is demand for cable TV personalities to go directly to consumers via social media, especially among younger cohorts.
Excerpt of Charts From Full Report:
PTON – For Some or For All?
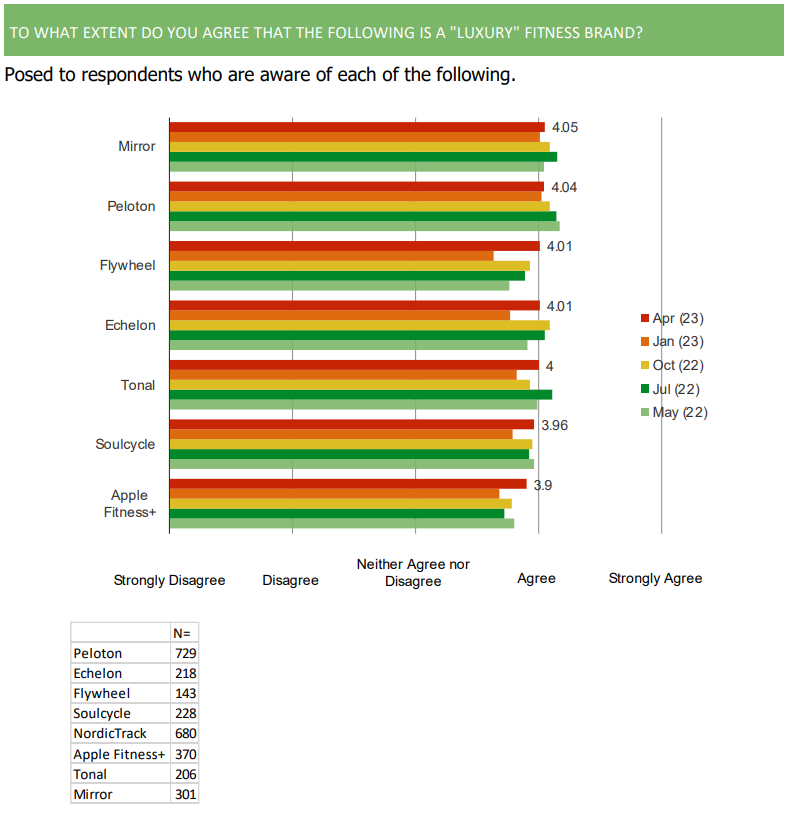
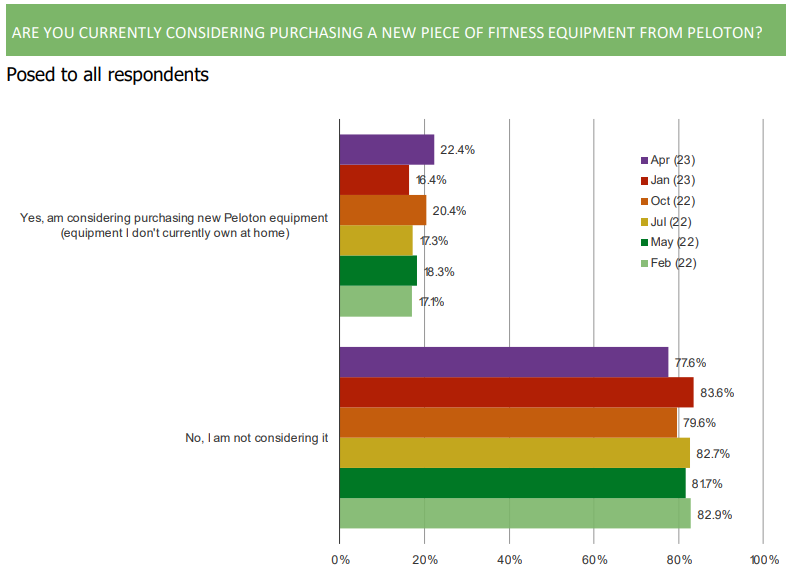
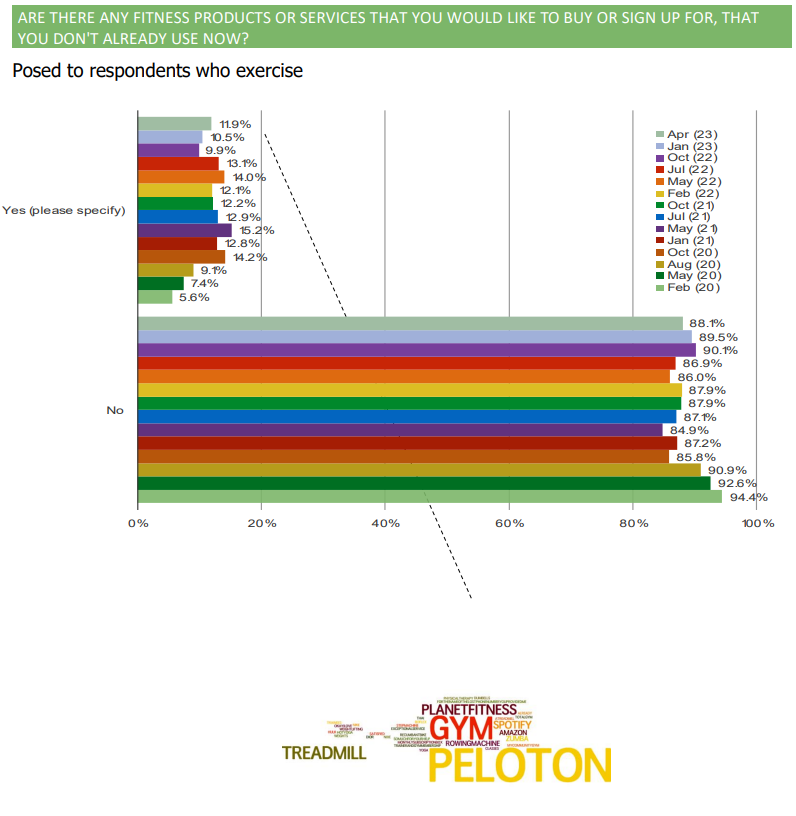
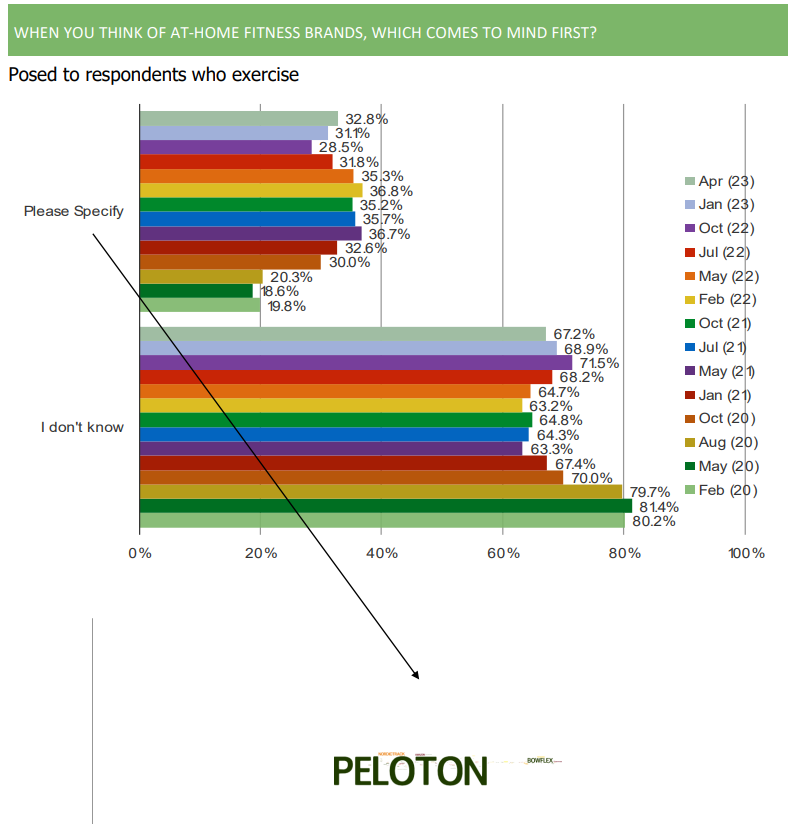
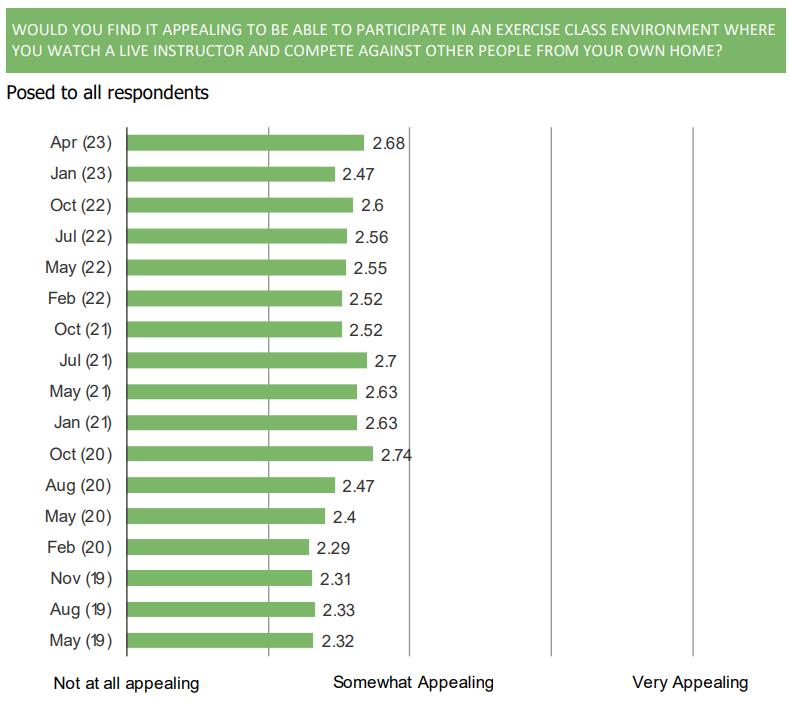
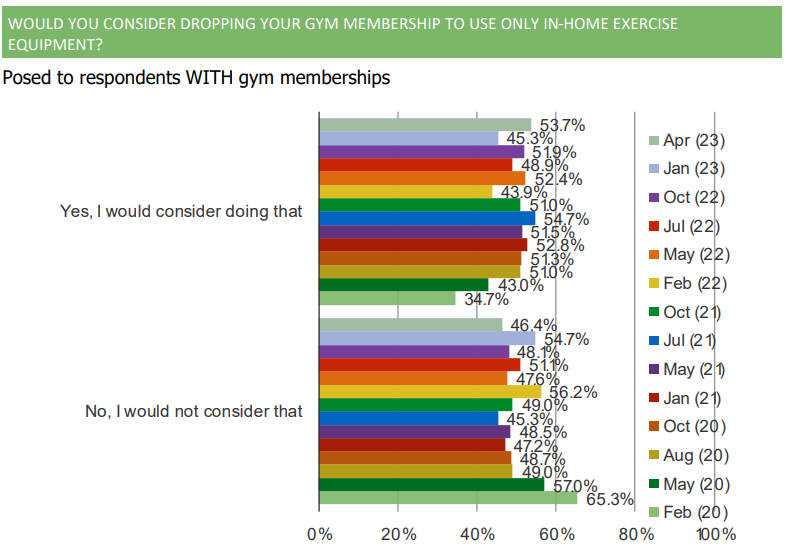
The more consumers at large consider Peloton to be a fitness and wellness brand for all, as opposed to a luxury hardware brand for some, the larger the TAM opportunity will be for the Peloton app. No better way to gauge this than to ask consumers directly and track sentiment over time.
Though there are exceptions to this rule, changes in consumer perceptions toward brands move more like sherman tanks than sports cars. More simply put, it takes some time to get the engine going and doesn’t happen overnight.
In the chart below, you can see that Peloton was once the viewed by the highest share of consumers who are aware of it as a “luxury” brand. Peloton has shown progress in “de-luxurifying” itself in the eyes of consumers. By contrast, most other brands in the chart have been flattish or up in the luxury perception scale.
July 2023 PELOTON SURVEY DUE OUT SOON
The July wave of our Peloton survey is currently in-field, with results forthcoming in the next few days. If you are a client, you will be able to find the report in our research portal soon. If you are not a client and want to learn more about the full scope of what we cover in this survey or how to get access (available off the shelf or as part of membership tiers), please let us know ([email protected]).
NYT | ARPU Leading Indicator
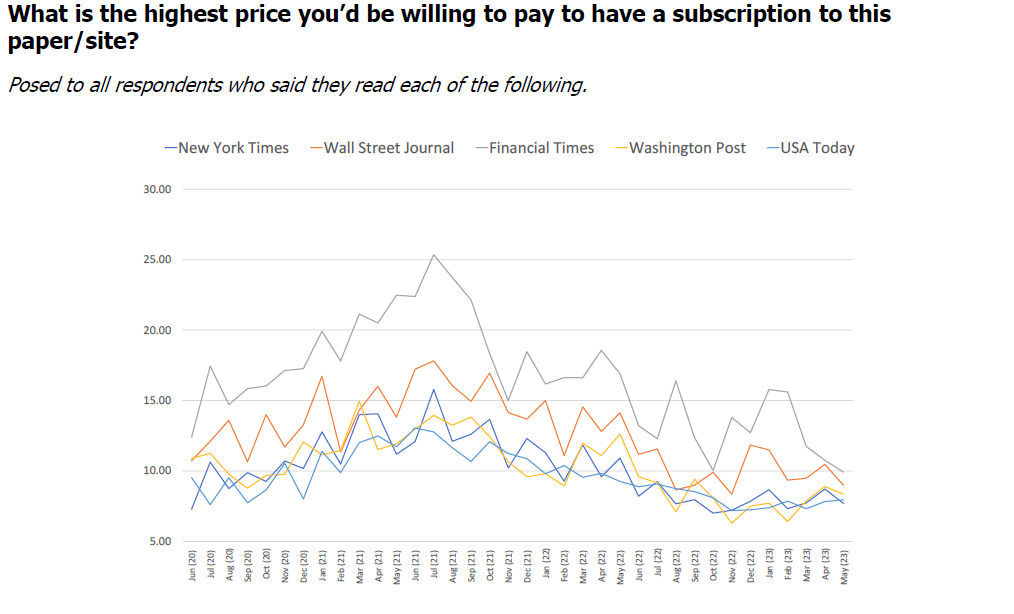
Each month, we isolate readers of various publications and ask them how much they would be willing to pay per month to have a subscription to that site/paper. The chart below shows that the amount readers self-reported being willing to pay peaked during the height of Covid concern (in 2021) and has declined since.
During the most recently quarterly earnings report from the NYT in May, the company reported growing subscribers but lower digital only subscription revenue (indicating possible shifts in subscriptions to lower / promotional subscription prices).
We have a number of interesting insights in our full survey report. If you are a client, login to our portal to view the full report. If you are not a client and want to learn more, please email [email protected].
Low-Cost Retail | Trading Down
Sharing some color from our most recent Low-Cost retail survey…
We’re seeing that the share of respondents who point to higher or much higher pricing at Walmart and Target has declined sequentially, but that perception remains that pricing is elevated relative to historical trends.
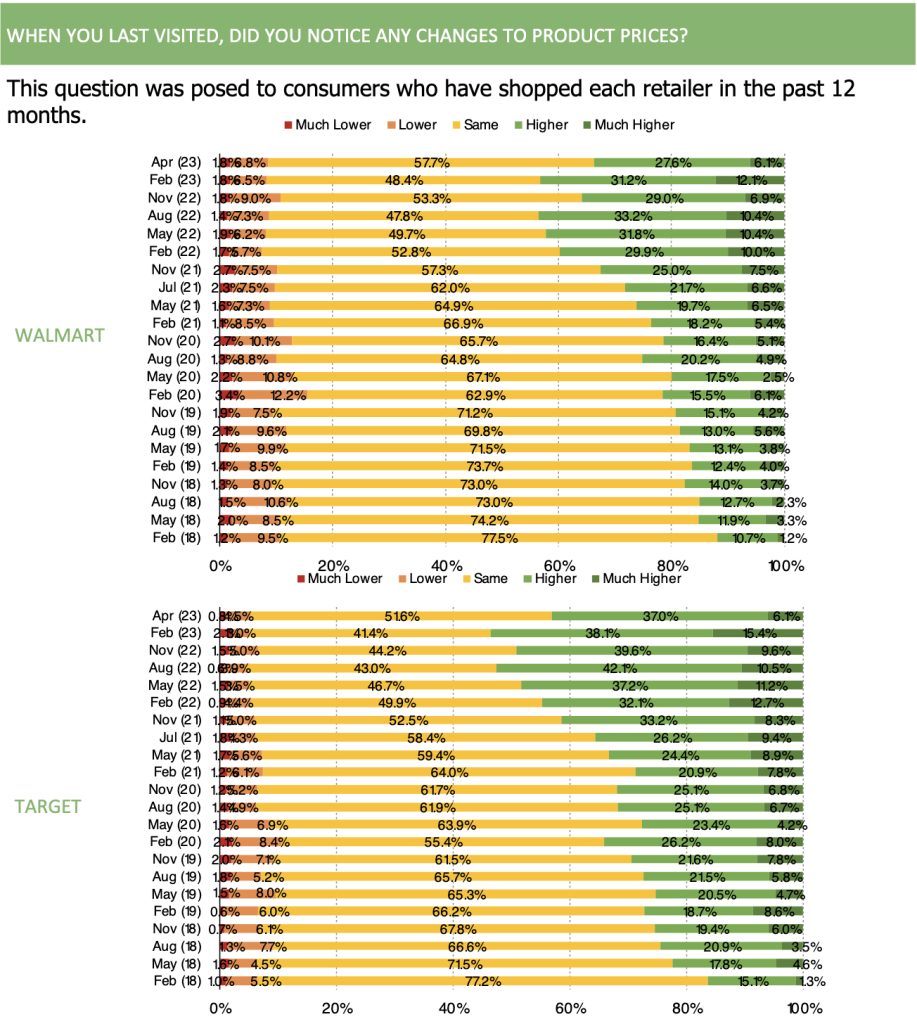
Those who are shopping target less recently point that they are buying on Walmart or Amazon more.
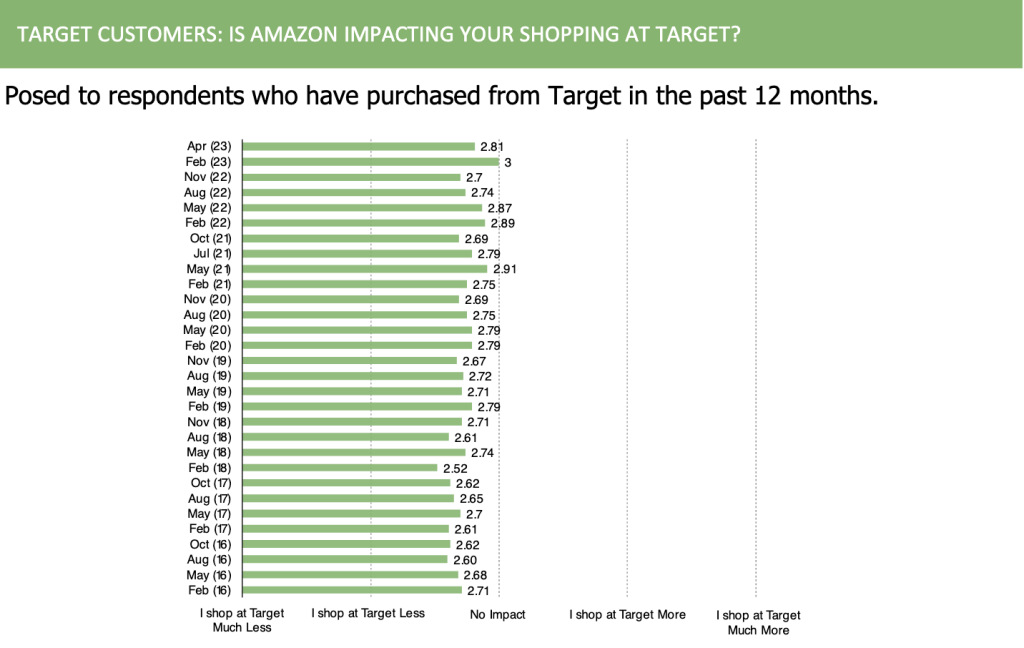
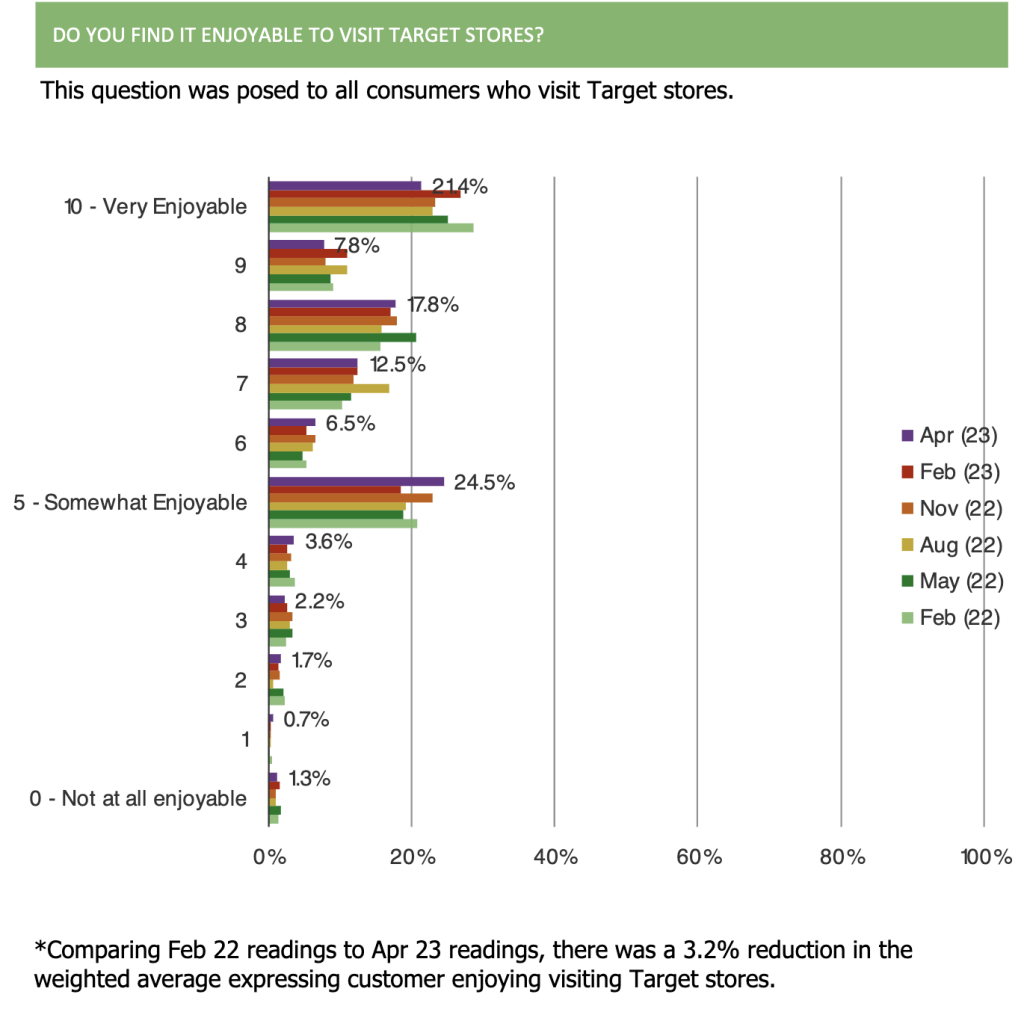
We’re also seeing that visit frequency softened a bit sequentially. It’s important to note that over the past 6 quarters, there has been a slight gradual decline in self-reported enjoyment with the in-store shopping experience.
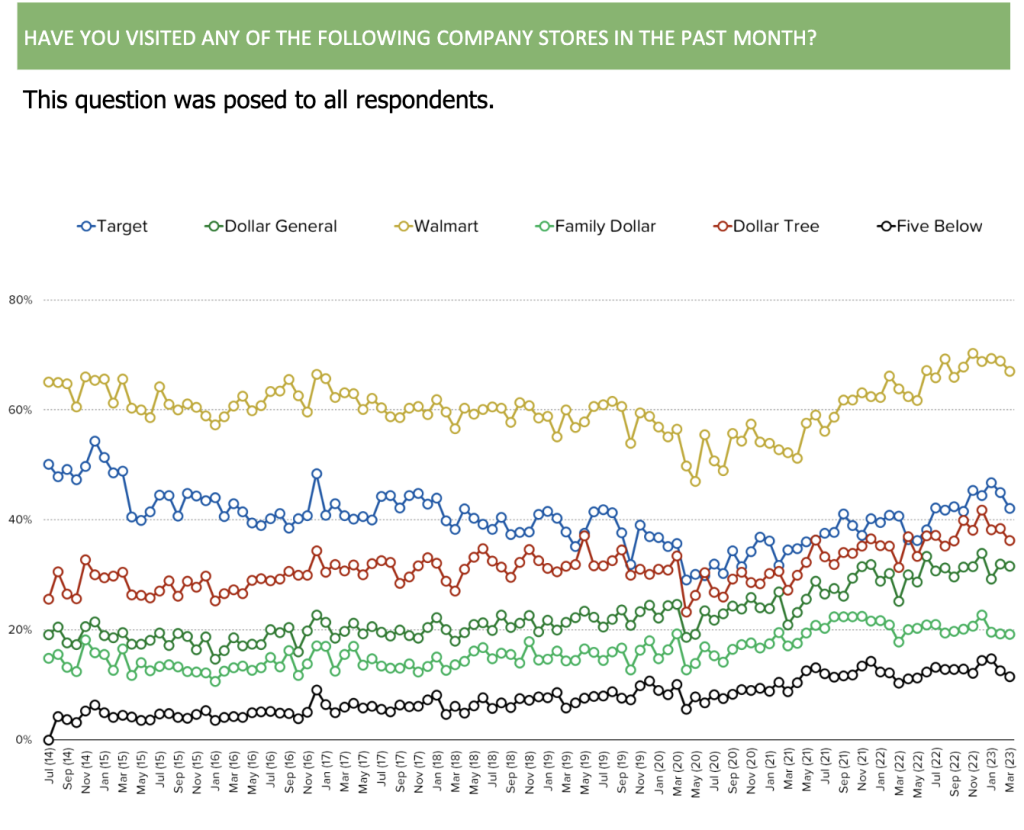
And here’s some color from our monthly tracker
If you are a client login (bespokeintel.com/login) to access all reports.
If you are not a client and are interested in learning more about our survey data, email [email protected] or call 914-630-0512
META: Reels Gaining on TikTok
Over the past year, we’ve been asked by clients to track how consumers view the integration of Reels on Instagram. This has become an especially notable topic over the past few months with talks of a full-scale TikTok ban in the U.S. In our latest Social Media Survey to domestic consumers, we dug deep on this topic and gained some valuable insights into the minds of social media users. Sharing a few notable insights from the survey below.
TikTok Ban:
On net, consumers in the U.S. are supportive of a TikTok ban. Daily TikTok users are the only cohort to strongly oppose a ban.

TikTok vs. Reels:
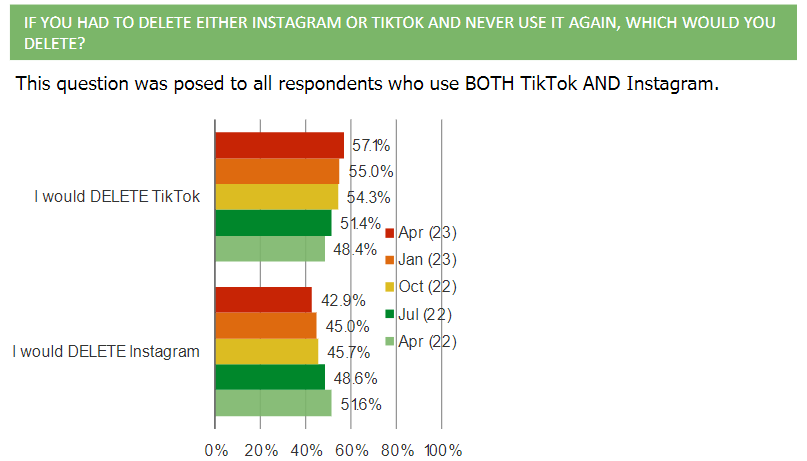
The share of TikTok and Instagram users who would delete TikTok if forced to choose between the two has grown over time. Instagram reels familiarity, engagement, and sentiment KPIs have improved sequentially.
Usage Trends & Demographics:
In the event of a ban, TikTok users continue to indicate that they would increase their usage of Instagram and YouTube. Though TikTok users don’t call Snapchat a beneficiary nearly as often as other social media platforms, it is worth noting that Snapchat users are the most likely userbase to also be on TikTok.

If you are a client, login to view the full report (bespokeintel.com/login).
If you are not a client and are interested in hearing more about our social media data, email [email protected].
TSLA: Price Cuts & Demand Catalysts
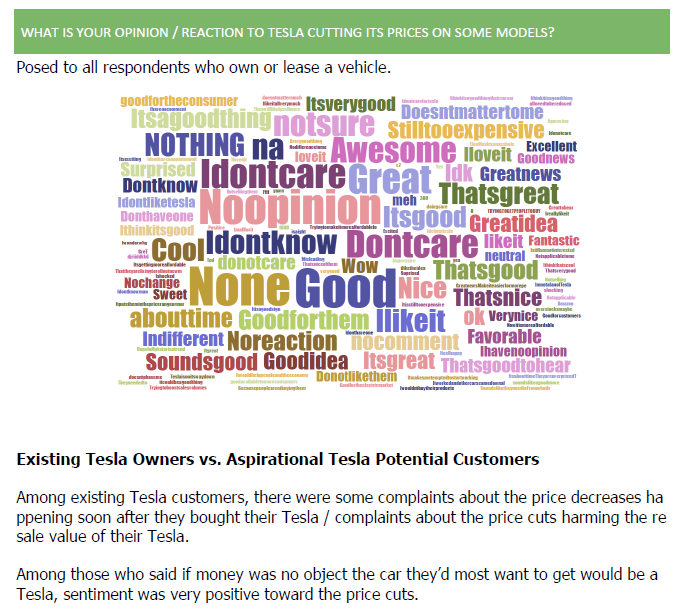
Since January, Tesla has implemented price cuts on their vehicles on five separate occasions. Consumers have shown a broadly favorable view towards these price cuts, though we should note that some existing Tesla owners had complaints about the price cuts harming the resale value of their vehicle.
Among respondents who expressed that they were interested in purchasing a Tesla at some point in the future, there has been a steady shift over the past two years in the catalyst for why they wanted a Tesla. Sentiment has shifted from consumers wanting one because it is an electric vehicle, to wanting one because they like the brand and look of the vehicle.
We go much deeper into auto and EV trends in the full report. If you’re a client log in at bespokeintel.com/login to view it. If you are not a client but are interested in viewing the full report, email [email protected]
DASH vs. UBER | Who wins?
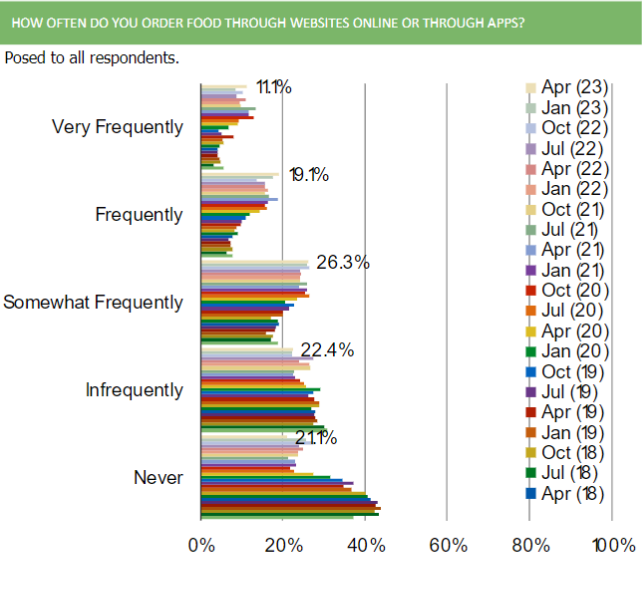
We saw that food delivery usage surged during the pandemic. In 2022, however, ordering frequency softened a bit compared to pandemic highs. In the past 1-2 quarters, self-reported usage has bounced back a bit.
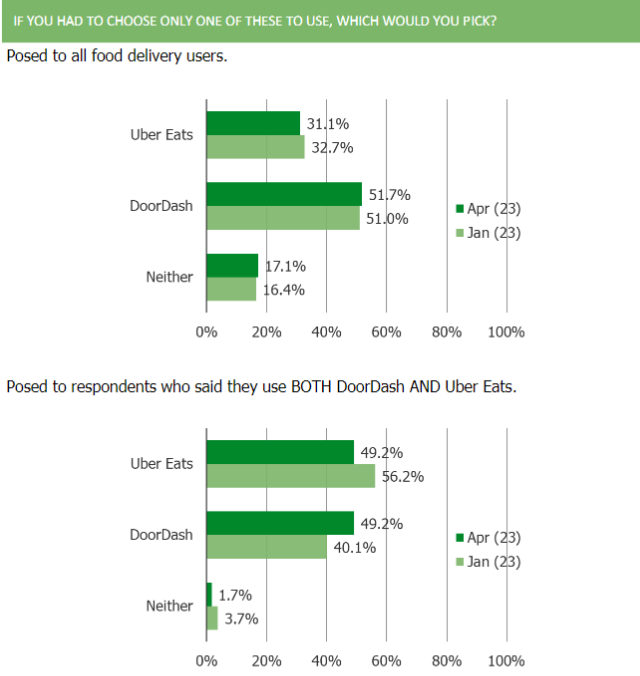
Throughout the history of the survey, we’ve also tracked competitive dynamics among food delivery platforms. We see that DoorDash has more market share than Uber Eats, and has been a disruptive gainer throughout the history of our survey.
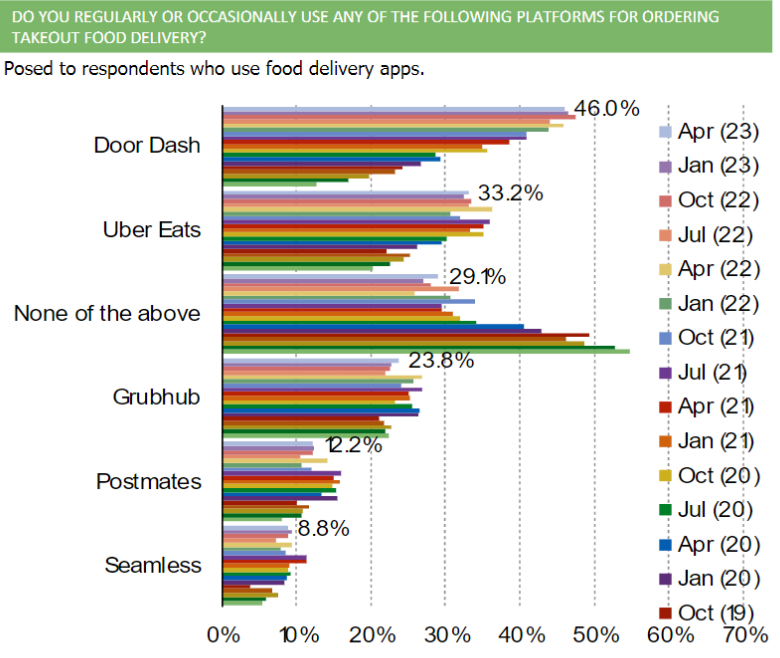
However, among those who use both DoorDash and Uber Eats, consumers are evenly divided in which they prefer more.
We dig in even deeper and have answers as to why consumers choose certain food delivery platforms over others as well. If you’re a client log in at bespokeintel.com/login to view the whole report. If you are not a client but are interested in viewing the report, email [email protected]