Blog
Bespoke Survey Insights
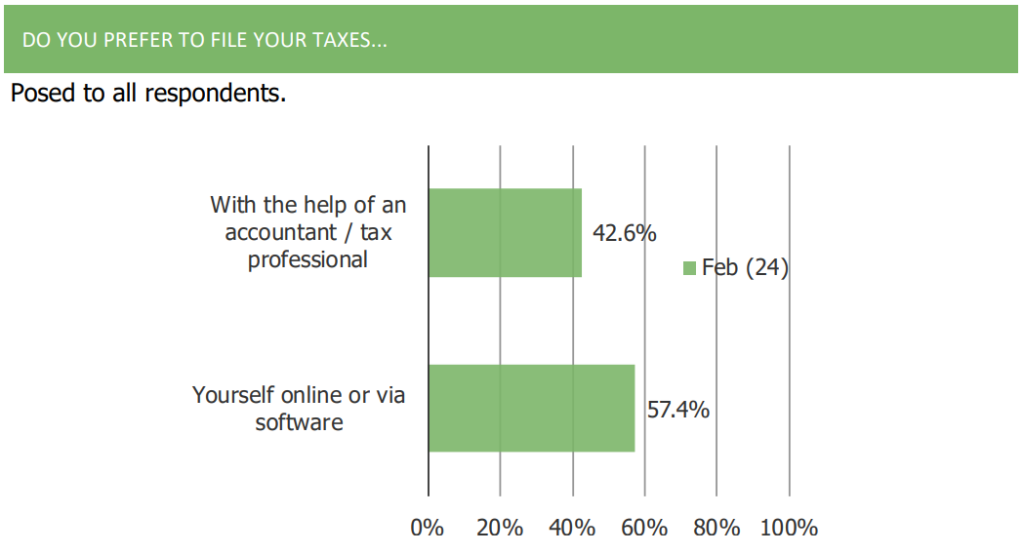
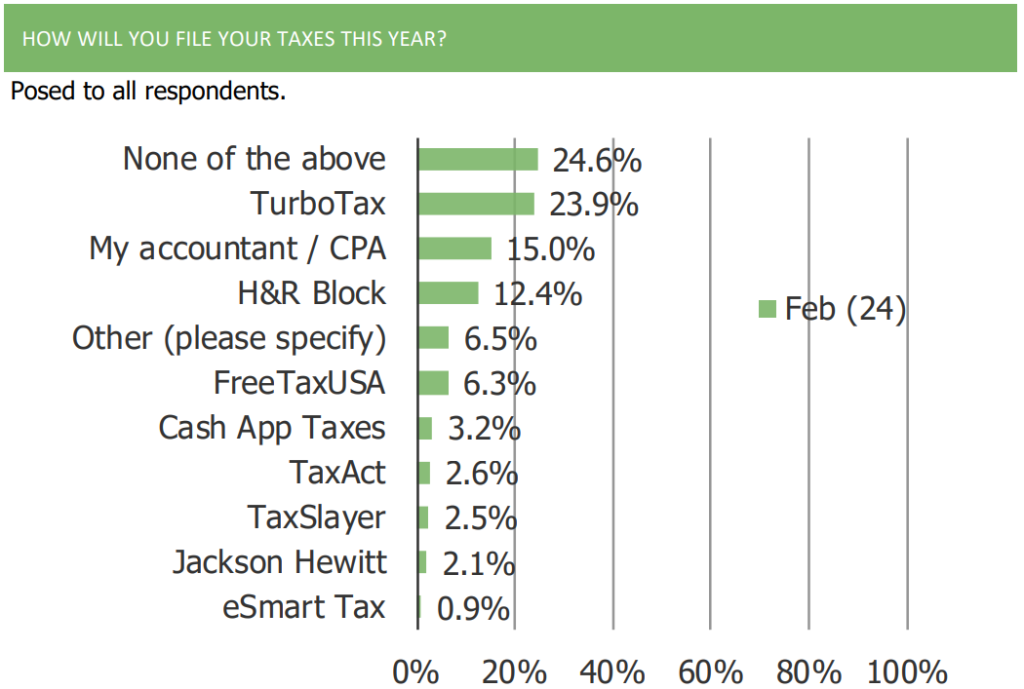
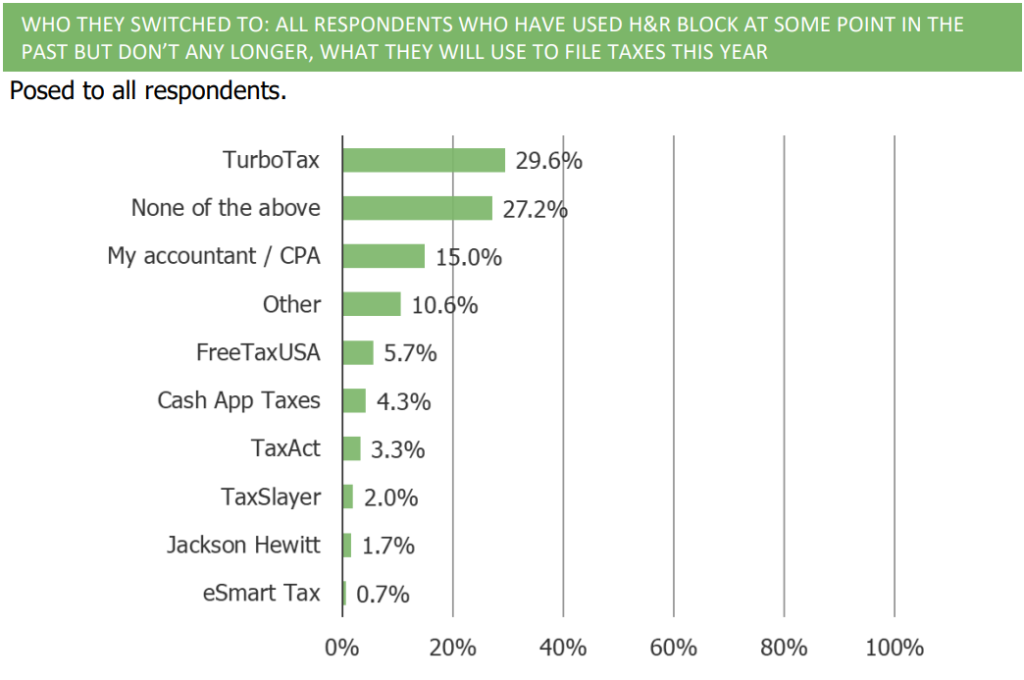
Tax Preparation Services | Top Three Takeaways
1. Respondents prefer filing their taxes online or via software over using the help of an accountant/tax professional.
2. Of the options provided to respondents, TurboTax was the most popular option for filing taxes.
3. Of respondents who have used H&R Block in the past, a plurality (29.6%) have switched to TurboTax.
Macro Outlook | Top Five Takeaways
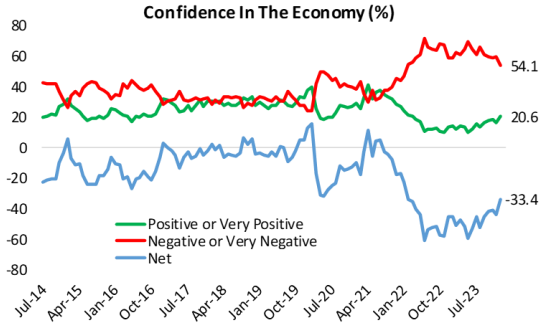
1. Consumer confidence in the economy has risen to the highest level in two years.
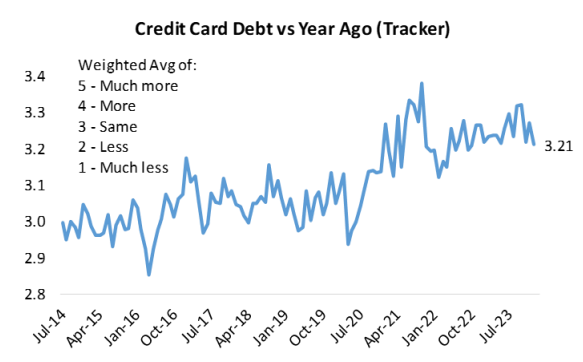
2. Respondents report credit card debt growing at a much faster rate than pre-pandemic norms.
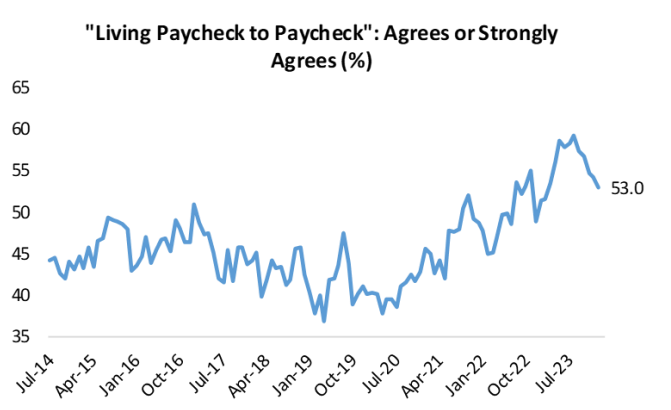
3. The share of respondents living paycheck to paycheck has hit 11-month lows.
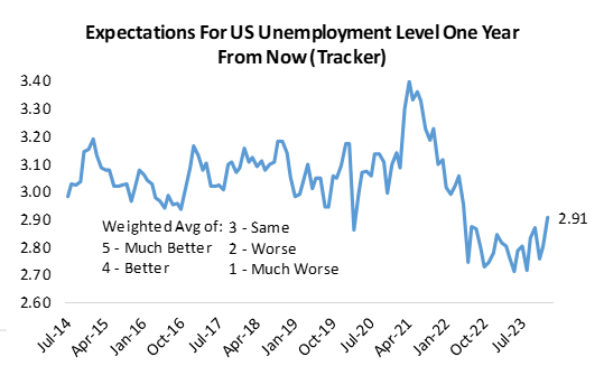
4. Consumers have become more optimistic on their outlook of the national labor market.
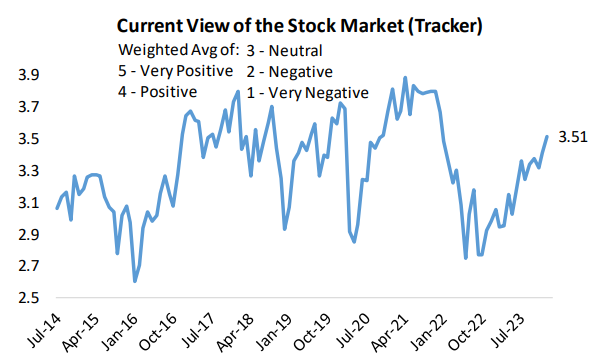
5. Consumer’s views of the stock market have risen sharply in recent months.
ROKU | Top Five Takeaways
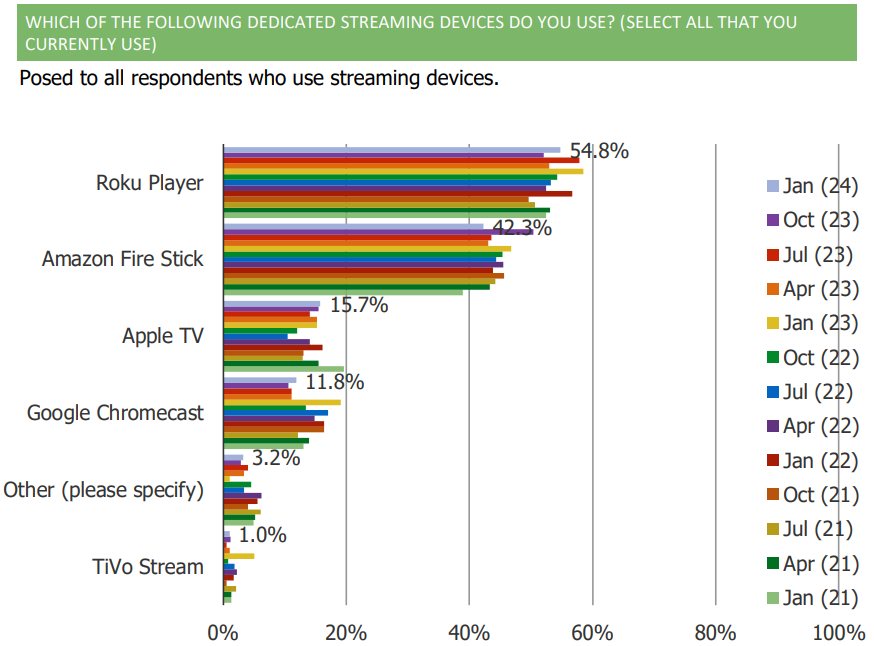
1. Roku remains the market share leader when it comes to dedicated streaming devices that consumers use. Roku leads Amazon Fire Stick and Apple TV.
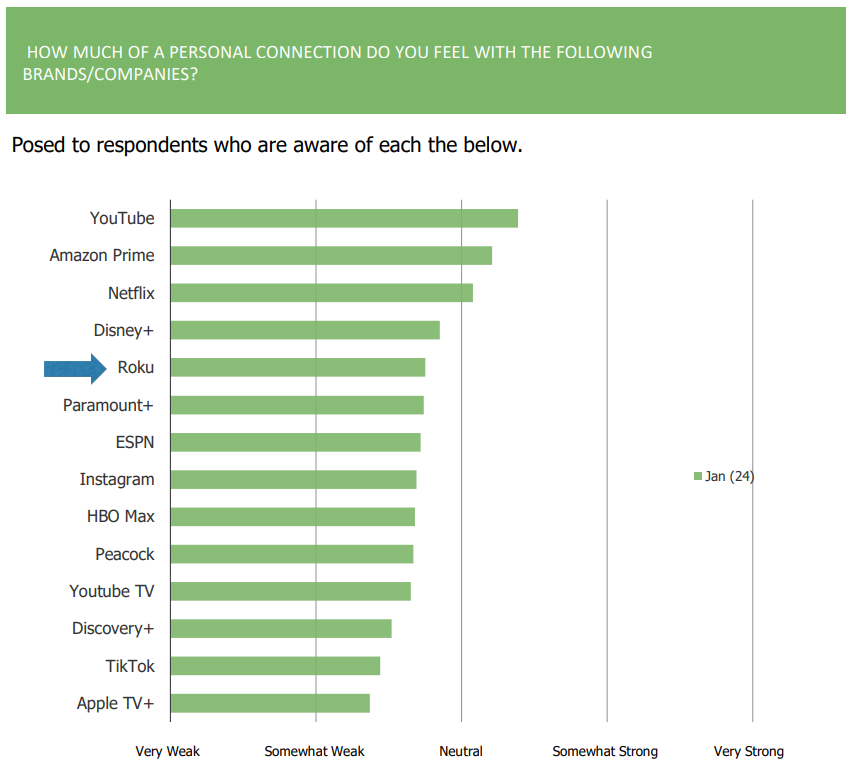
2. Consumers have a relatively strong level of connection to the Roku brand, on an absolute basis and relative to peers.
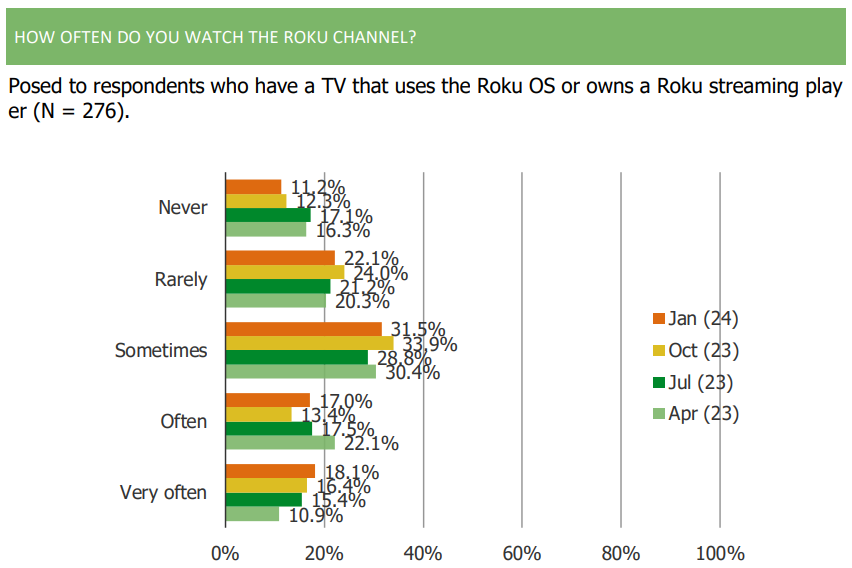
3. The share of Roku users who watch the Roku channel has increased sequentially.
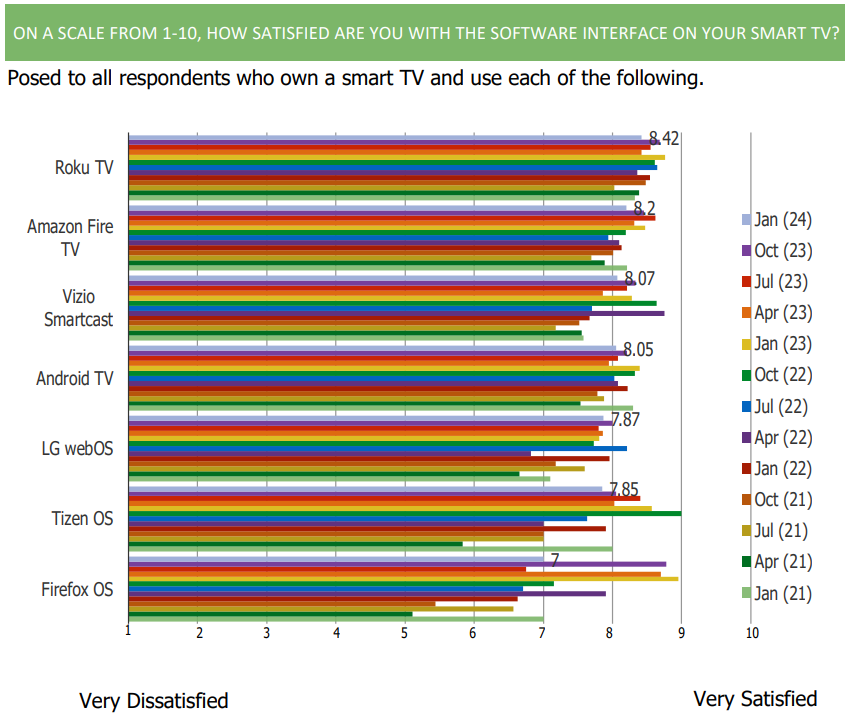
4. Consumer satisfaction with the Roku TV software interface remains high. Roku leads key competitors on this front.
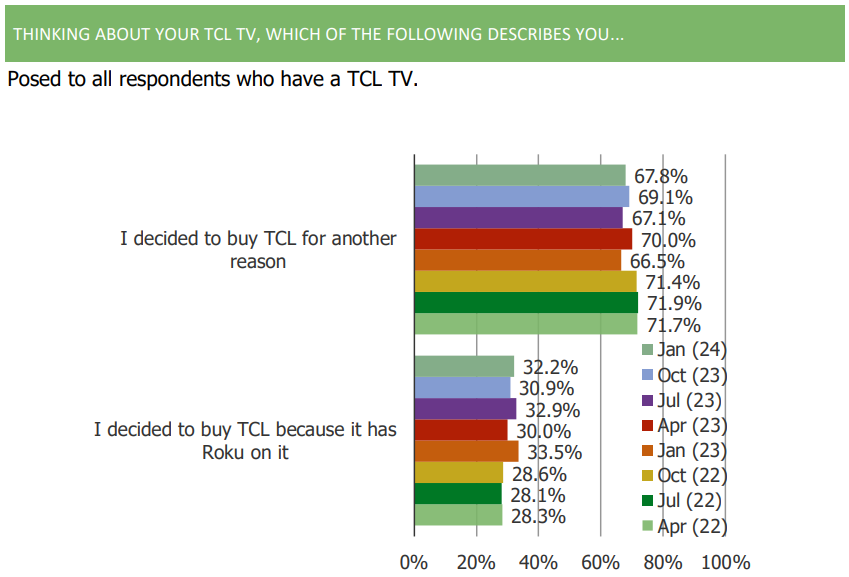
5. 32.2% of TCL owners said that they bought a TCL TV primarily because it had Roku TV on it.
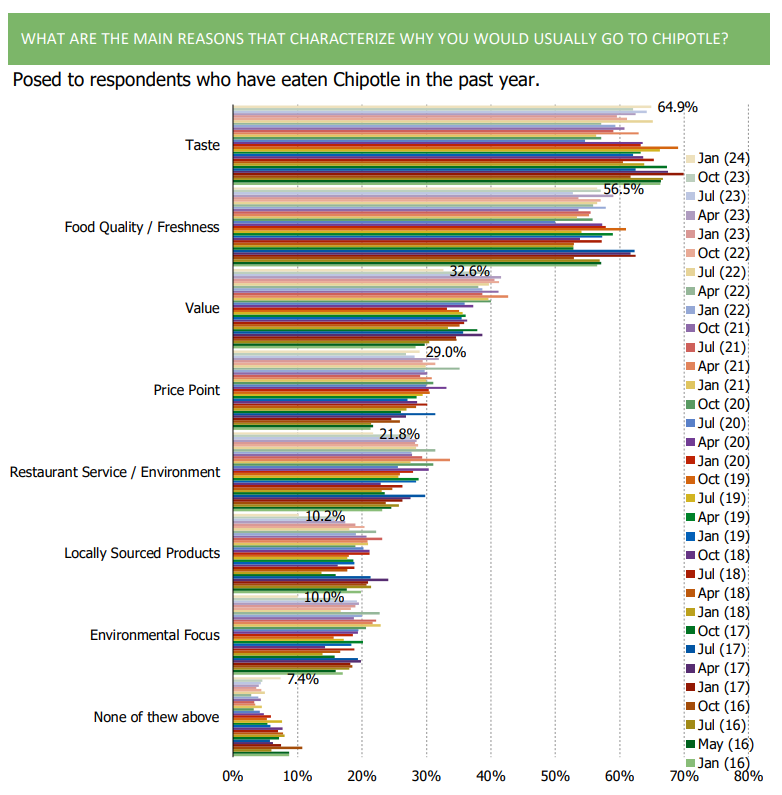
Chipotle (CMG) | Top Three Takeaways
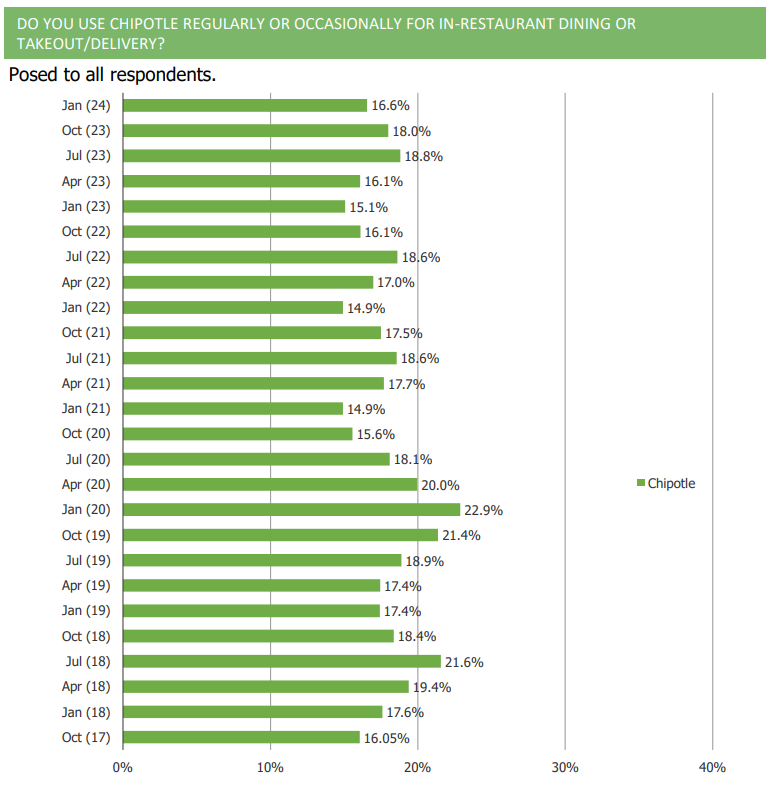
1. The share of consumers who self-report eating Chipotle regularly or occasionally has declined q/q.
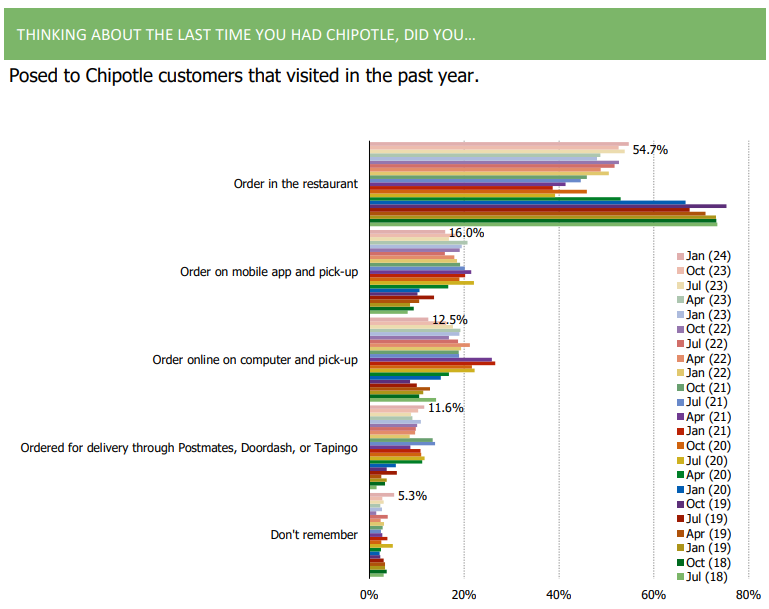
2. In store orders have rebounded in the last few quarters, while mobile orders have declined as of late.
3. Taste and quality remain the top reasons why consumers frequent Chipotle.
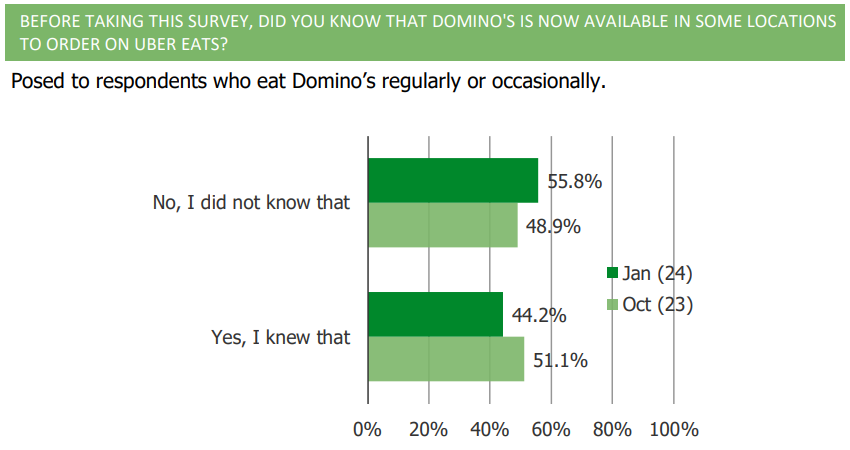
Domino’s | Three Takeaways
1. Awareness of the availability of Domino’s on Uber Eats has declined q/q.
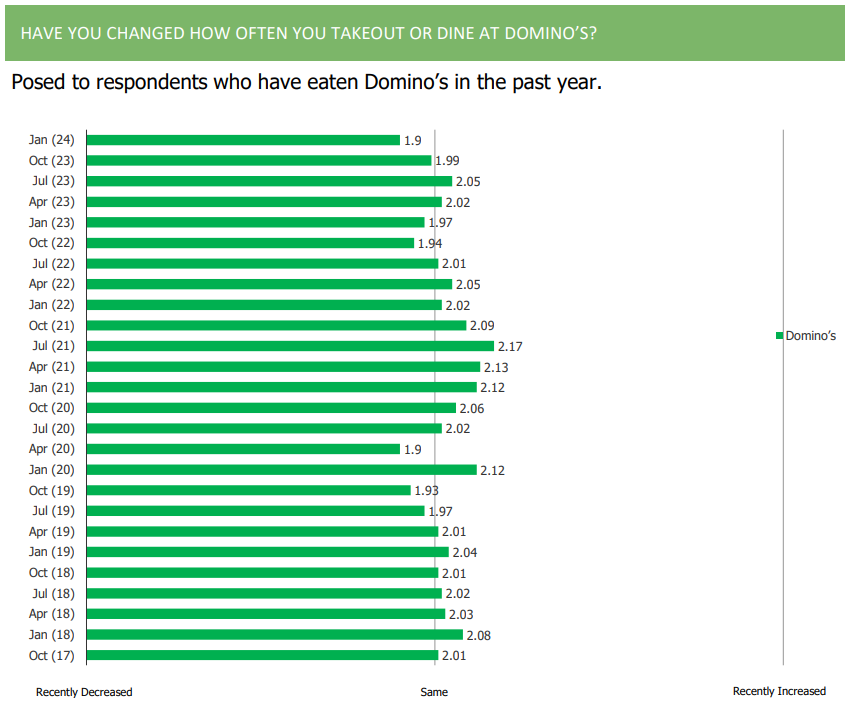
2. Like we have observed for other casual dining platforms in our surveys, feedback around engagement is softer sequentially for DPZ.
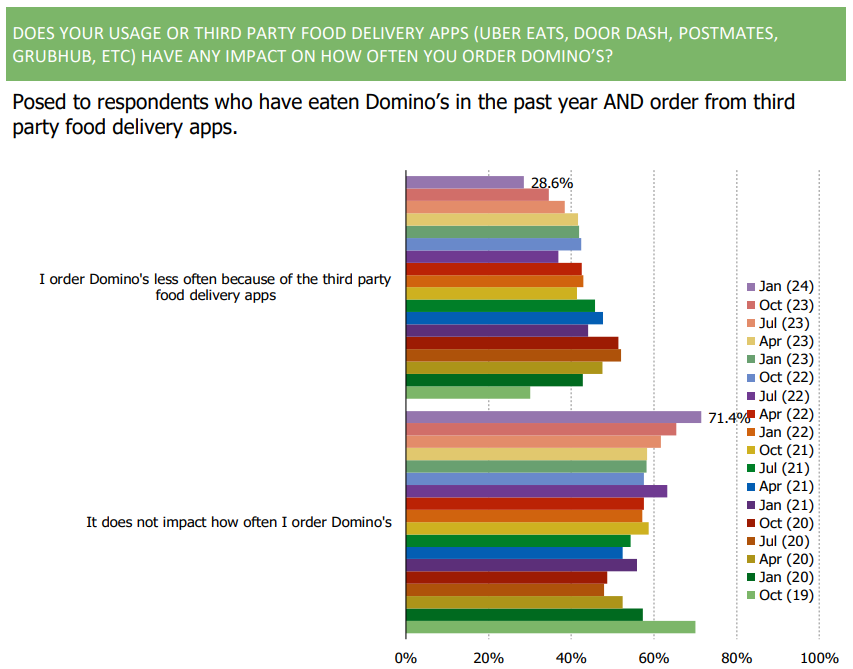
3. The share of consumers who say their usage of third party food delivery apps impacts their usage negatively continues to decline and reached a new series low this quarter.
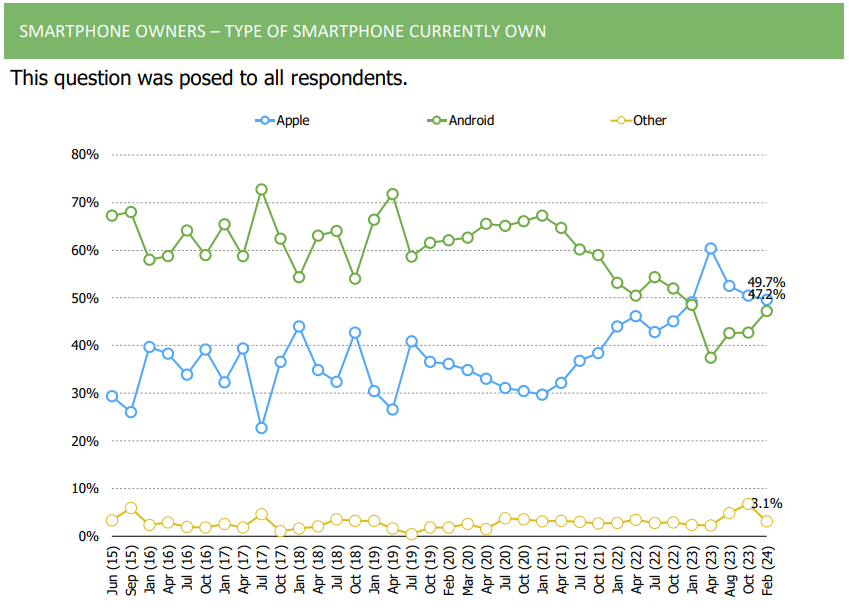
Consumer Electronics China | Top Three Takeaways
1. The share of iPhone users has continued to decline over the past few waves, but still leads Android slightly in our trackers
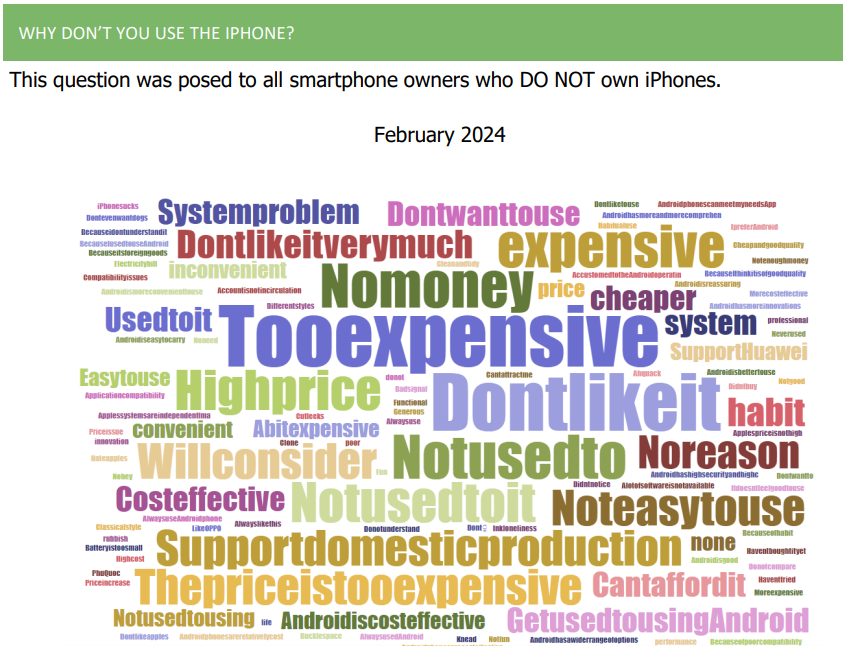
2. Price/cost remains one of the top reasons as to why Chinese consumers own less iPhones.
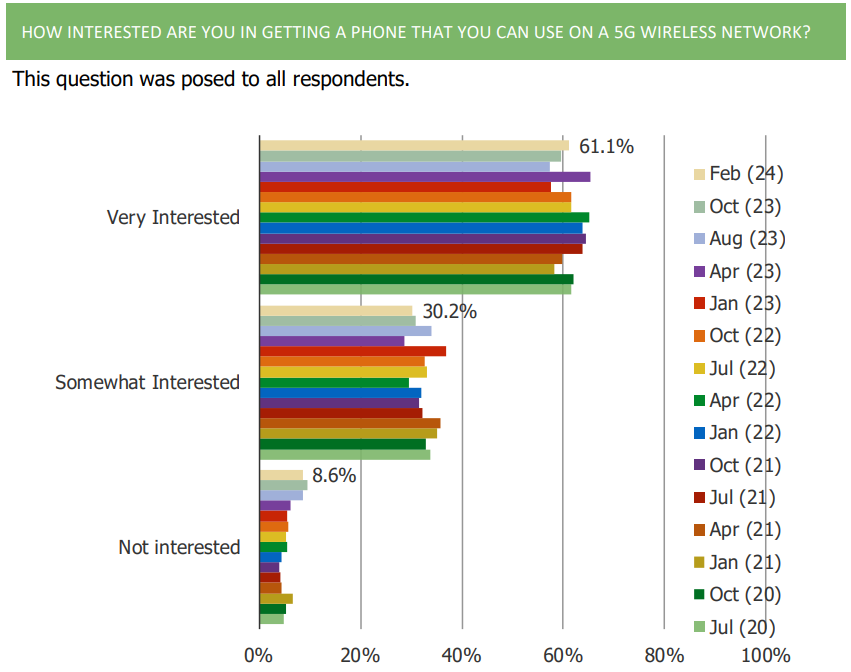
3. 61.1% of respondents noted that they are very interested in owning a smartphone that works with 5G.
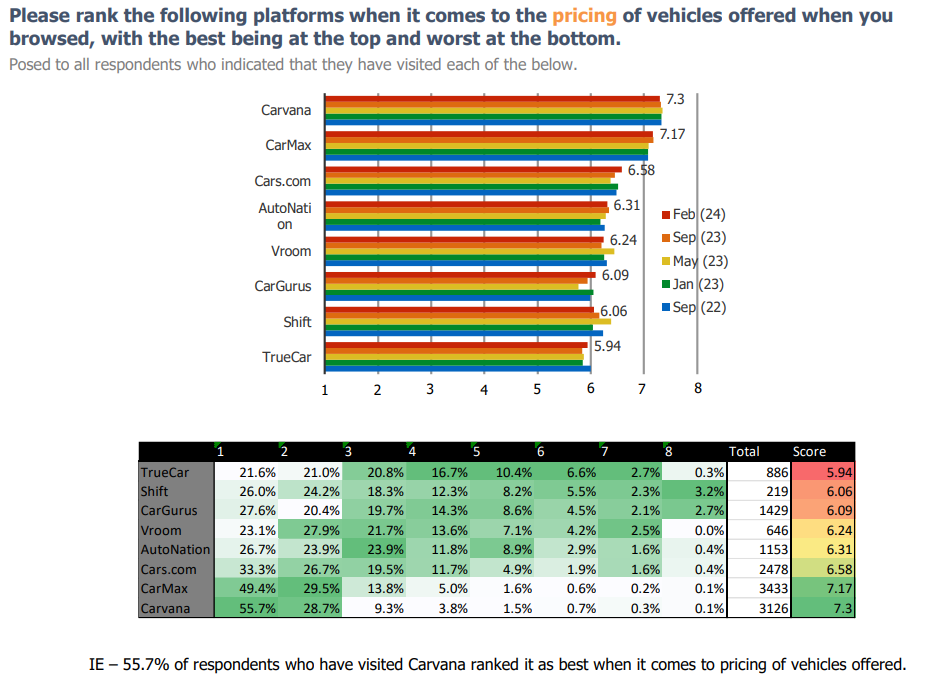
Carvana | Top Five Takeaways
1. Among those who have visited each online auto platform in our survey, Carvana ranks at the top when it comes to price and selection.
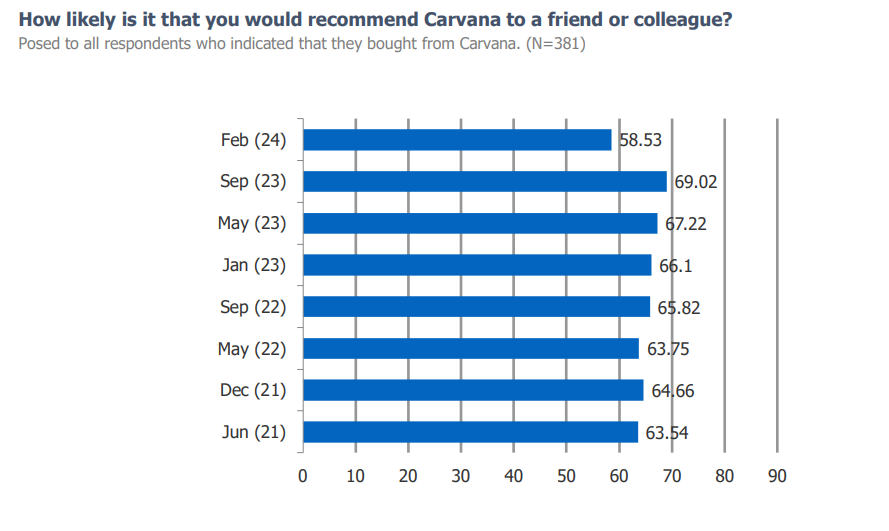
2. NPS for Carvana remains very strong but is slightly weaker this wave compared to last. Observing fluctuations in NPS for a platform like Carvana is not uncommon given the later adopter dynamic that unfolds over time.
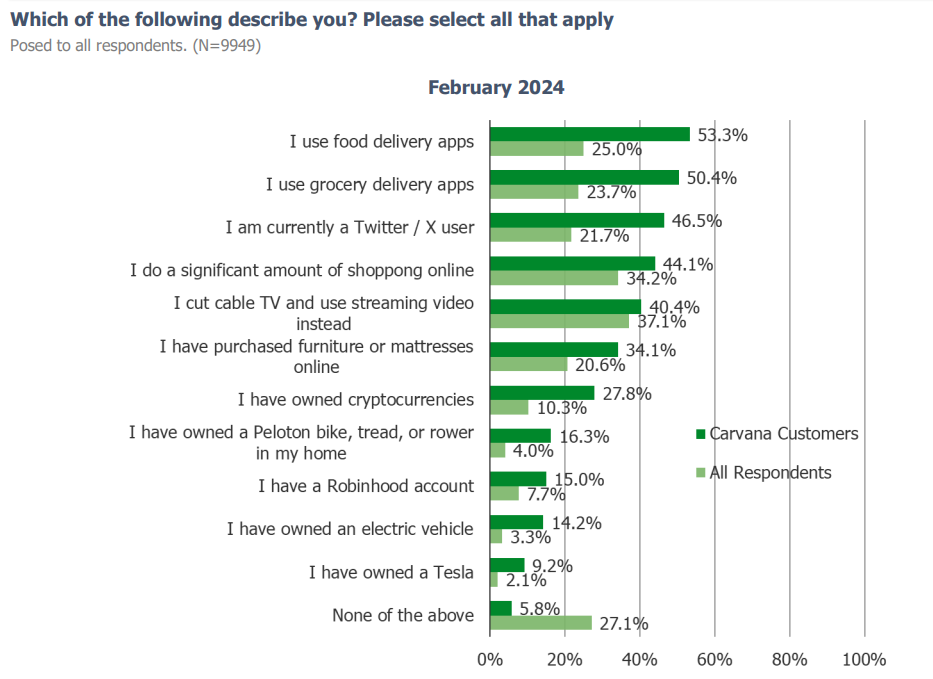
3. Carvana customers over-index as early adopters of disruptive technologies.
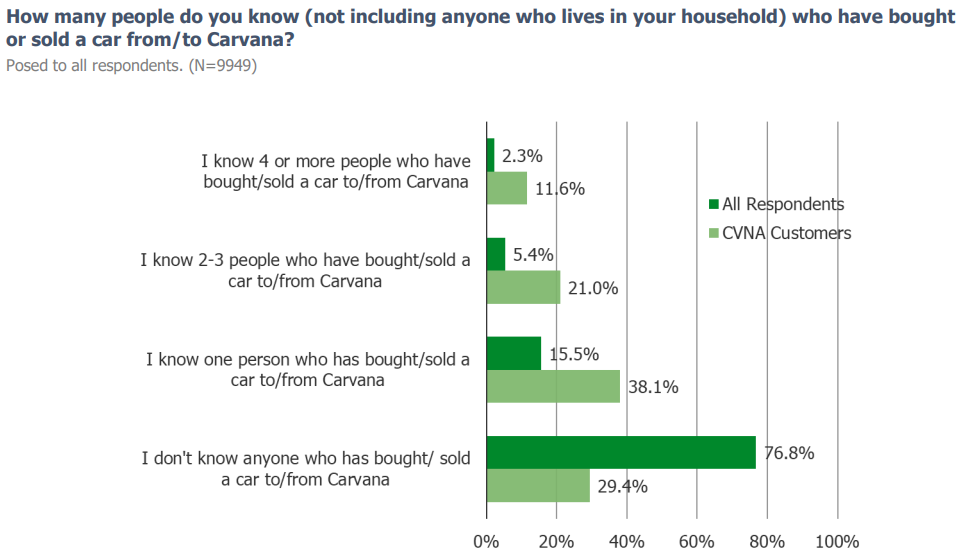
4. Most respondents who have purchased a vehicle from Carvana reported knowing at least one person who has bought or sold a car to Carvana.
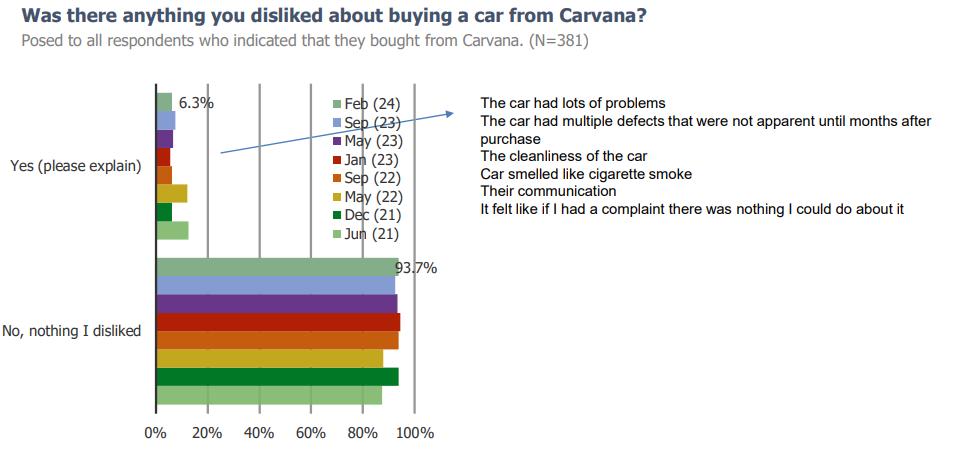
5. Overall, the feedback from Carvana customers remains positive. Customers love the convenience and ease of the platform above all else. Other customers mentioned liking the price and customer service. 90+% of customers consistently tell us that there was nothing that they disliked about buying a car from Carvana.
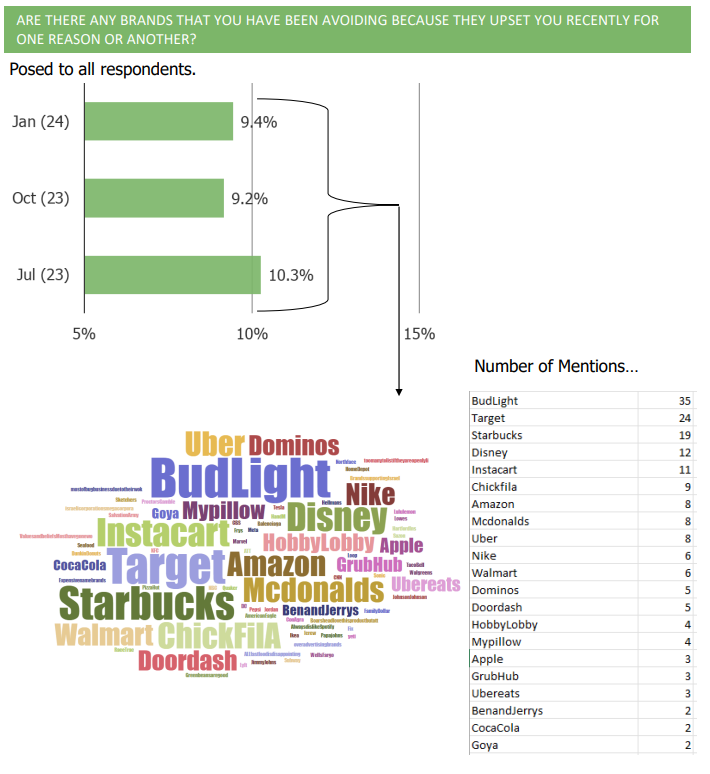
Consumer Rage & Love | Top Three Takeaways
1. Around 10% of respondents report that they are avoiding one or more brands because they are upset with them for one reason or another. Top brands mentioned on this front include Bud Light, Target, Starbucks, Disney, and Instacart.
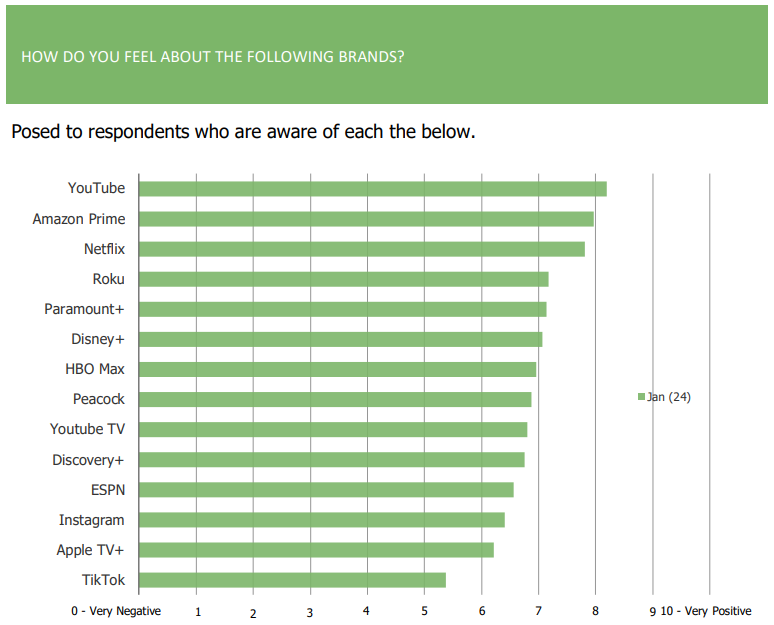
2. Brands that stood out as having very strong ties to those who are either aware of or active users of each platform include YouTube, Amazon, Netflix, and Roku.
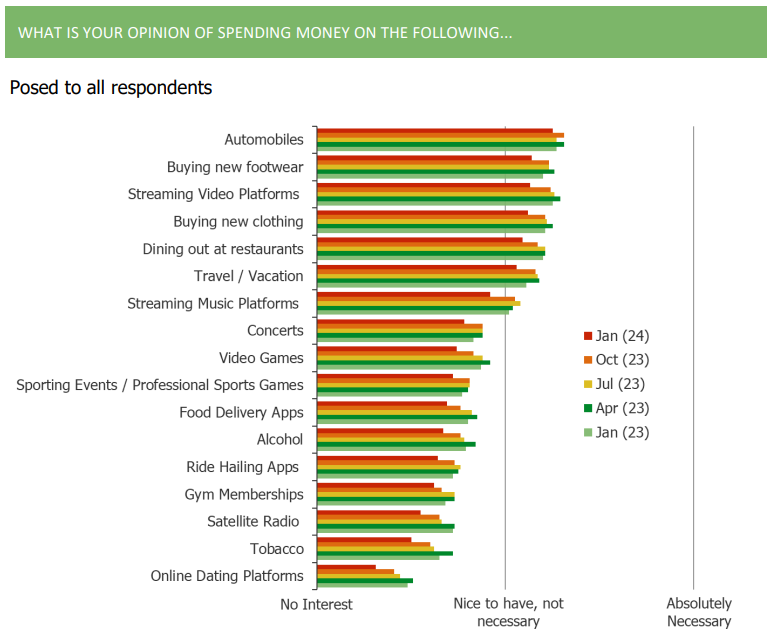
3. Consumers pulled back slightly in our January wave in their opinion of spending money across discretionary categories that we ask about.
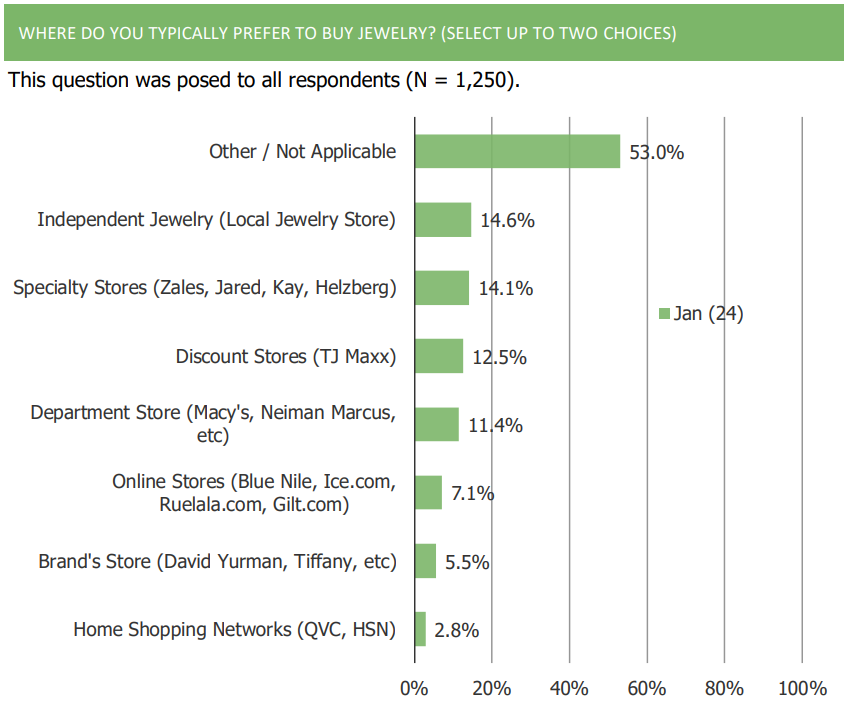
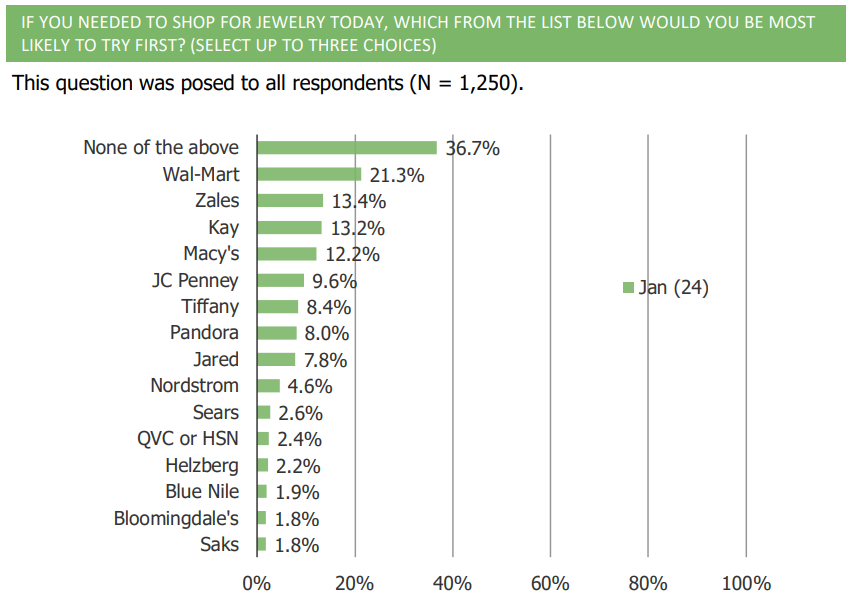
Jewelry | Top Three Takeaways
1. Consumers note that they primarily turn to independent jewelry and specialty stores to purchase jewelry.
2. If they needed to purchase jewelry today, consumers indicate that they would turn to Zales and Kay. Pandora fell more middle of the pack based on our tracker.
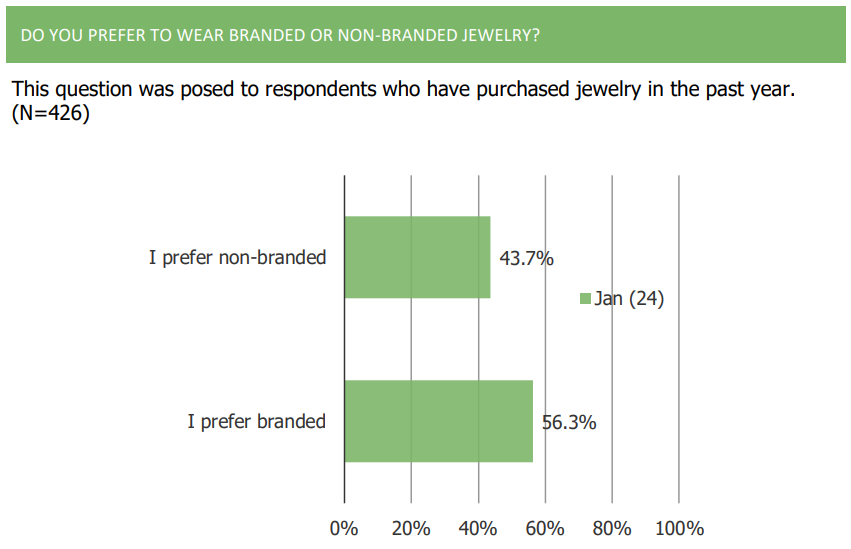
3. A majority of consumer prefer branded jewelry over non-branded.
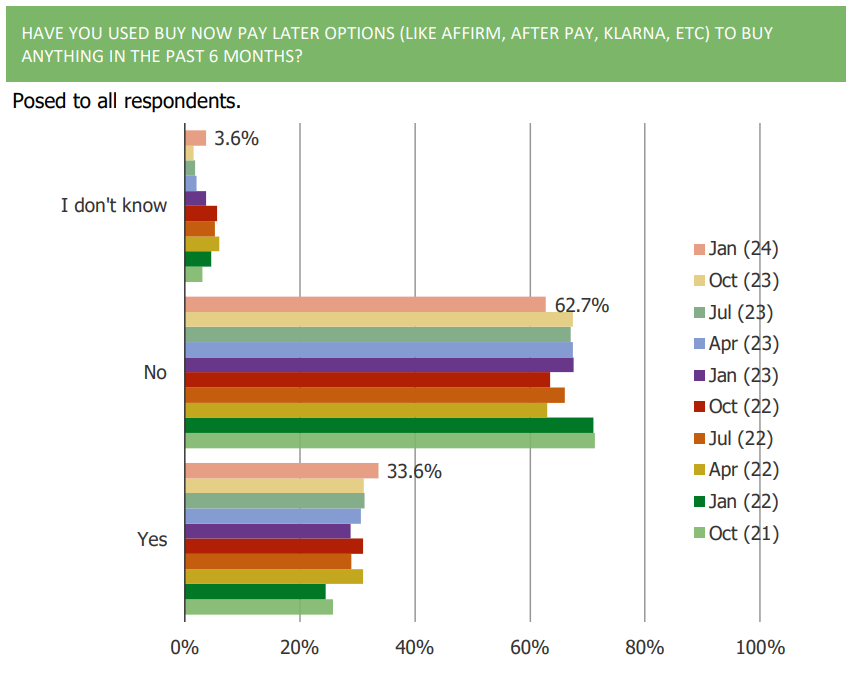
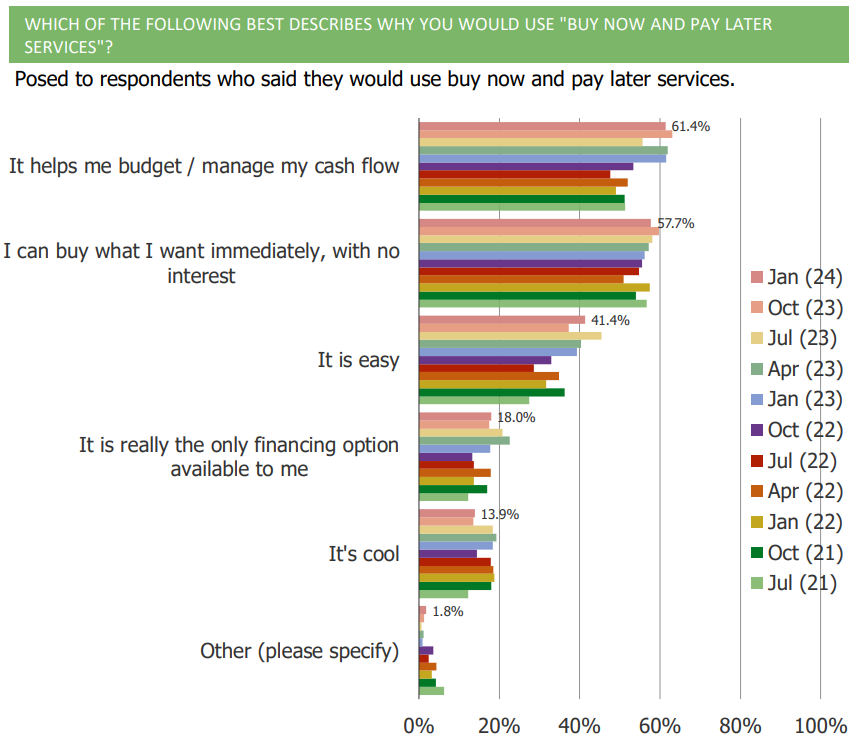
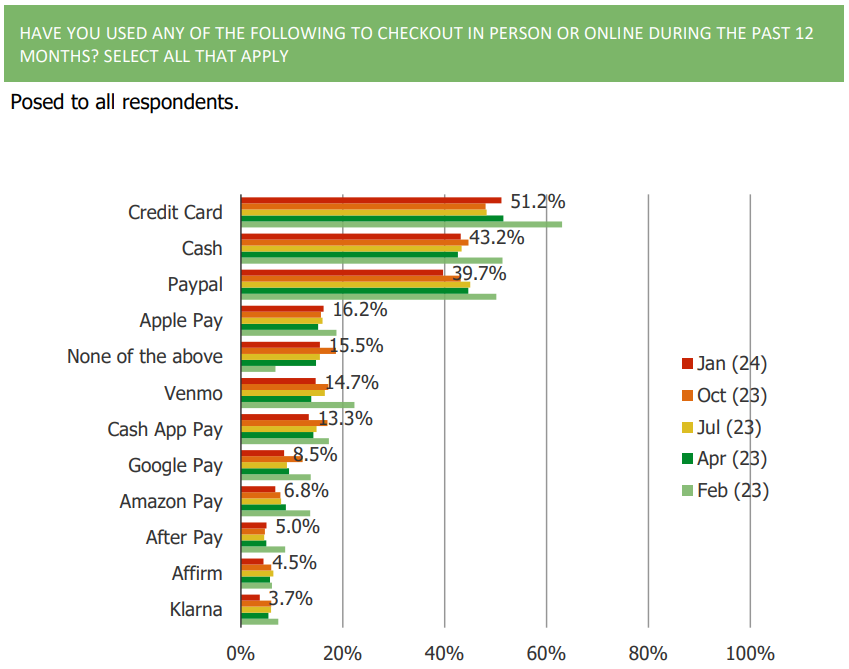
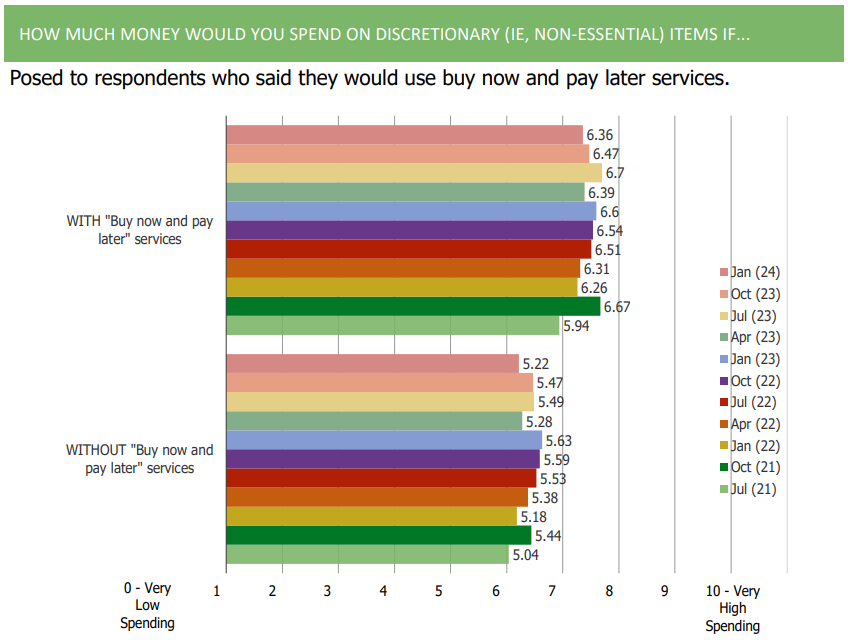
BNPL | Top Five Takeaways
1. The share of consumer who have used BNPL options has increased q/q and sits at series highs.
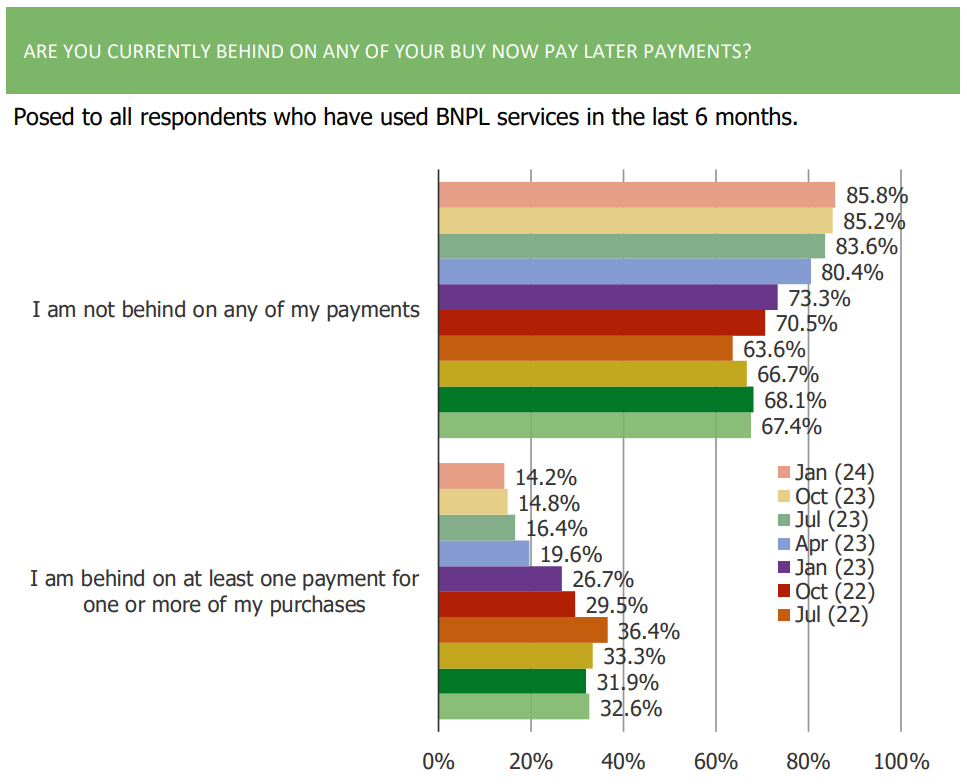
2. Delinquency rates on BNPL have improved slightly with over 85% saying they are not behind on payments.
3. 61.4% of respondents note that they would use BNPL services because it would help them budget/manage their cash flows.
4. Overall, BNPL offering such as Affirm, Klarna, and AfterPay continue to lag far behind credit cards, Apple Pay, and cash in terms of usage.
5. Consumers continue to note that they would increase their discretionary spending behavior with BNPL services vs. without.
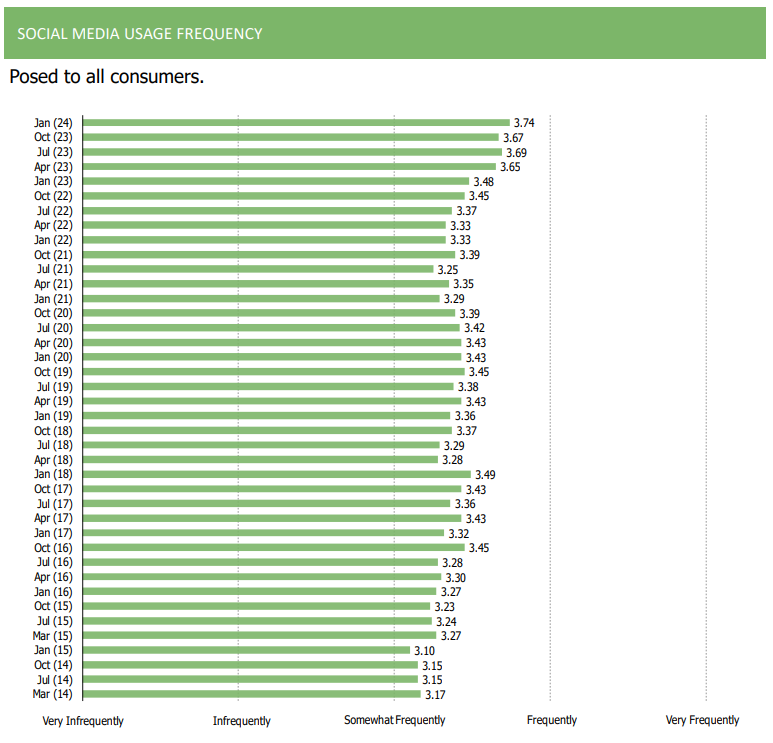
Social Media | Top Five Takeaways
1. Social media usage frequency has strengthened recently (and over time) with readings hitting new highs
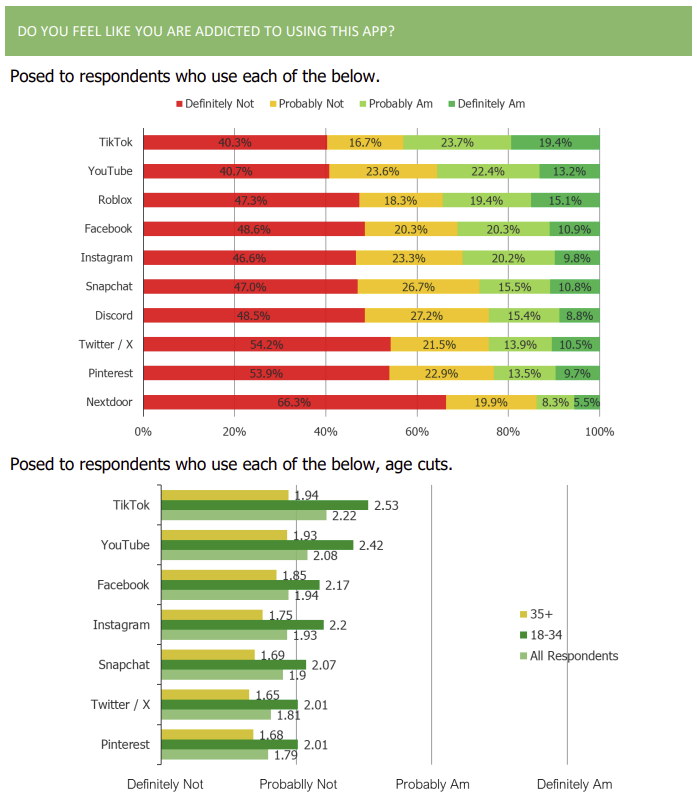
2. Users of TikTok are the most likely to feel that they are addicted to using the app. For all platforms, younger respondents are much more likely to feel they are addicted.
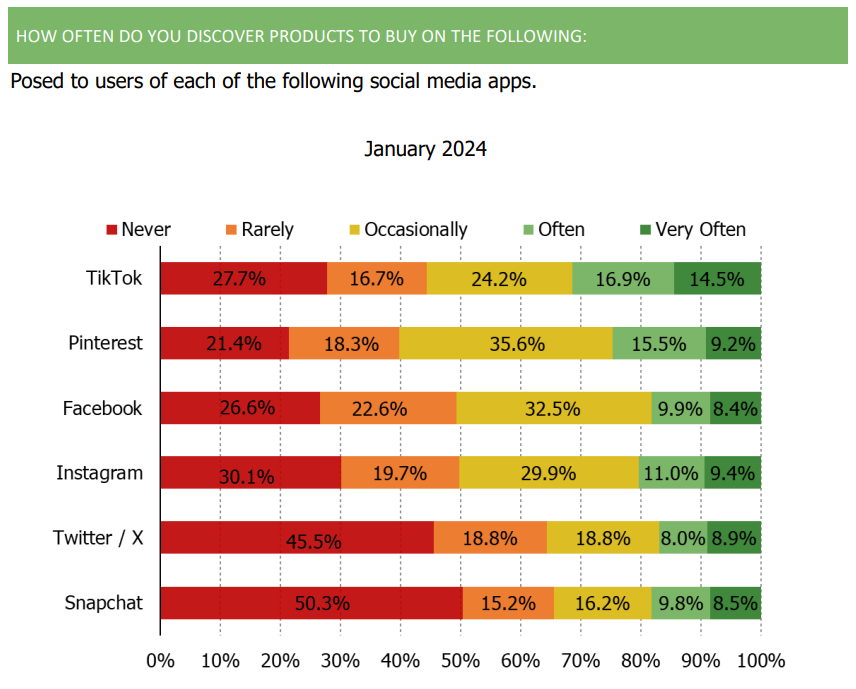
3. Users of TikTok are the most likely to say they discover products to buy while on the app. Pinterest was the second most likely userbase to say the same. Consumers have a net favorable (and improving) view of buying products through social media platforms.
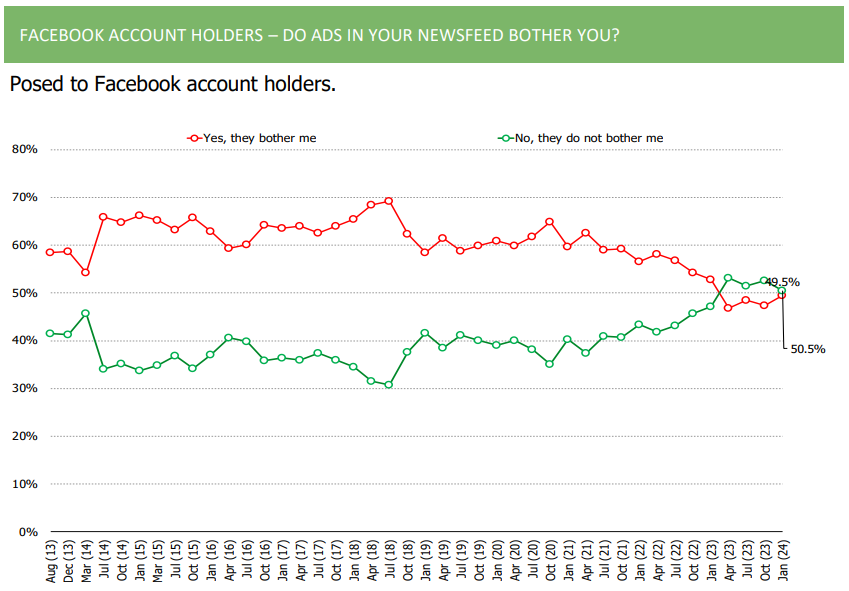
4. Since October of 2020, Facebook user feedback around ads has improved a good deal (how much ads bother them and if they have noticed an improvement in the quality and relevance of the ads that appear in their newsfeed).
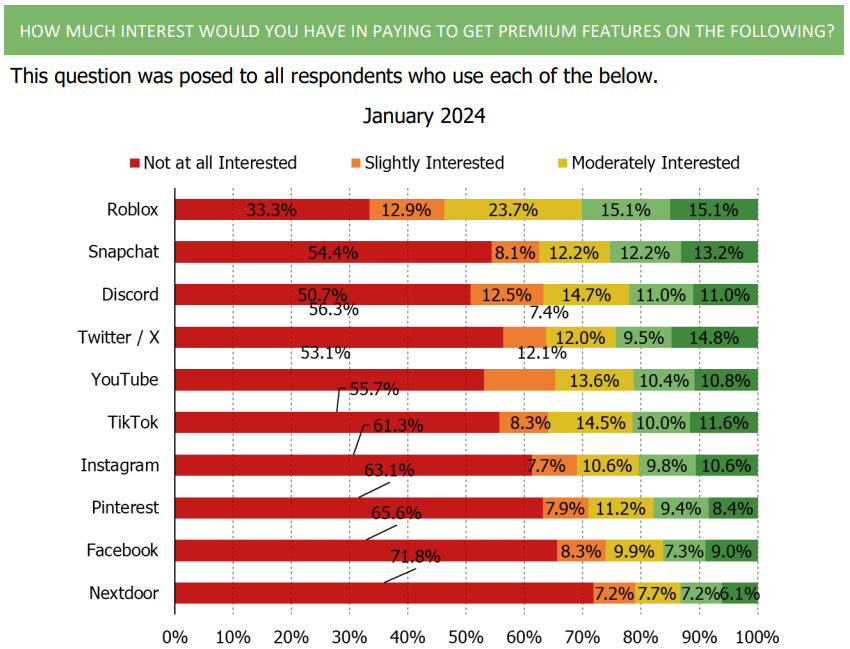
5. Snapchat users have been shifting their usage sequentially more and more toward using the platform for messaging and less for stories. We would also note that of all the user bases, Snapchat users are among the most likely to say they would be willing to pay for premium features.
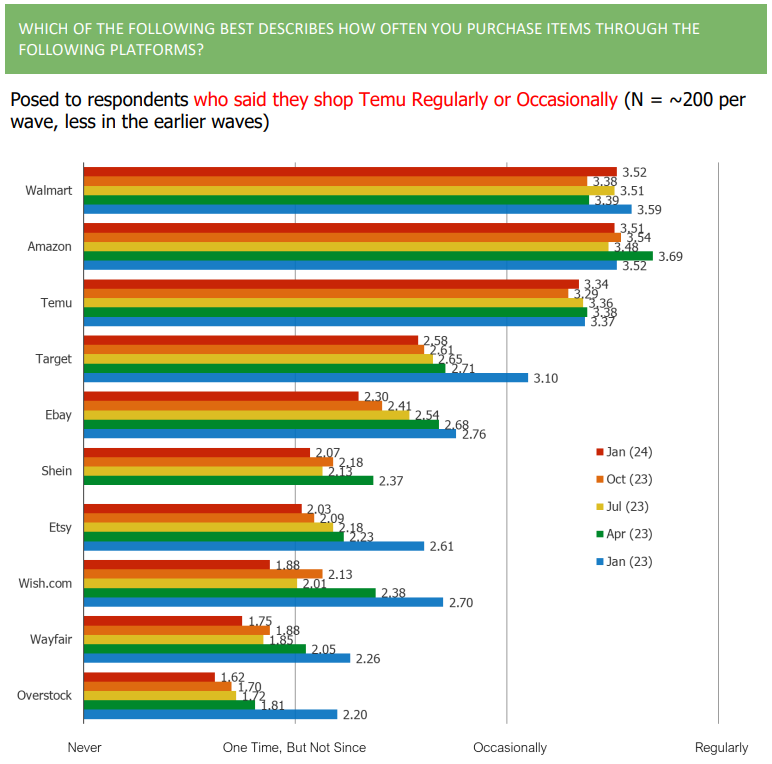
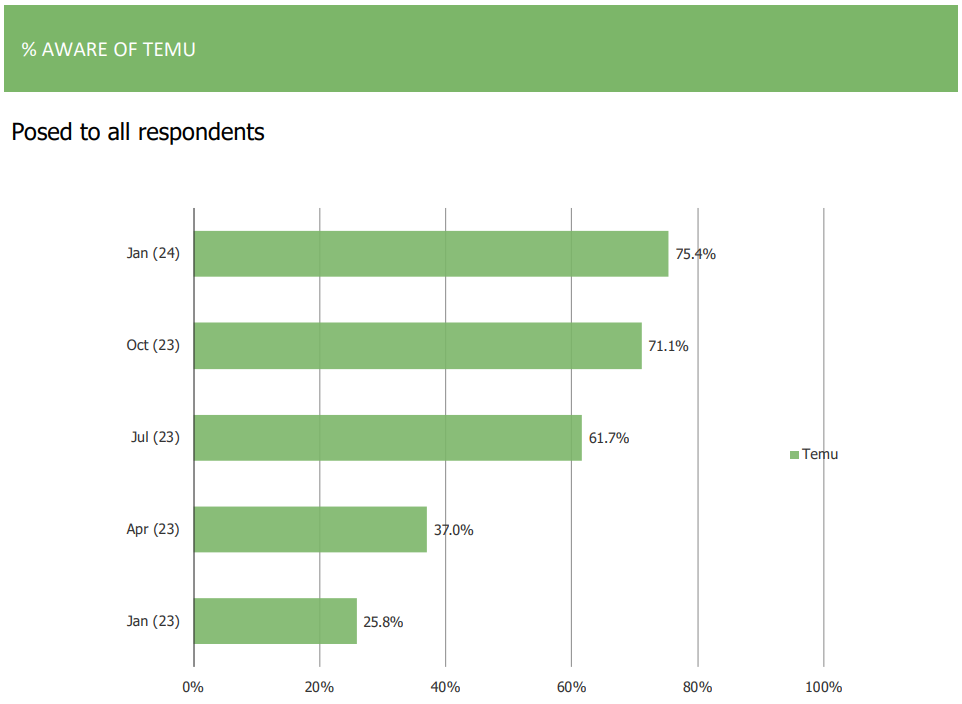
Temu Deep Dive | Five Takeaways
1. Temu awareness and the share of consumers who shop the platform increased sequentially continuing a trend of relatively consistent growth observed by our survey over the past year.
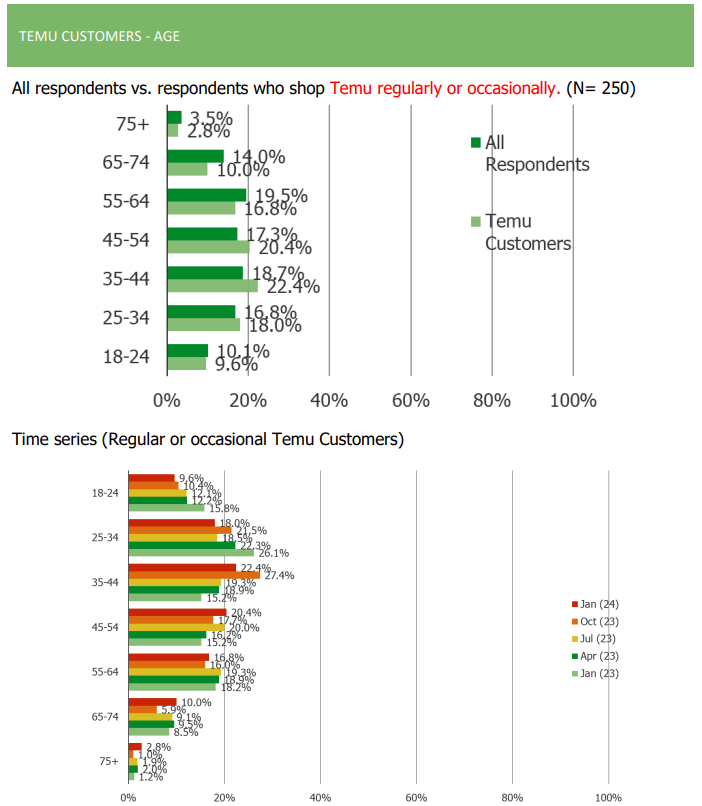
2. Temu users over-index to younger age groups, females, and lower income demographics. Over time, the average age of Temu users has increased with older bands adopting usage of the platform.
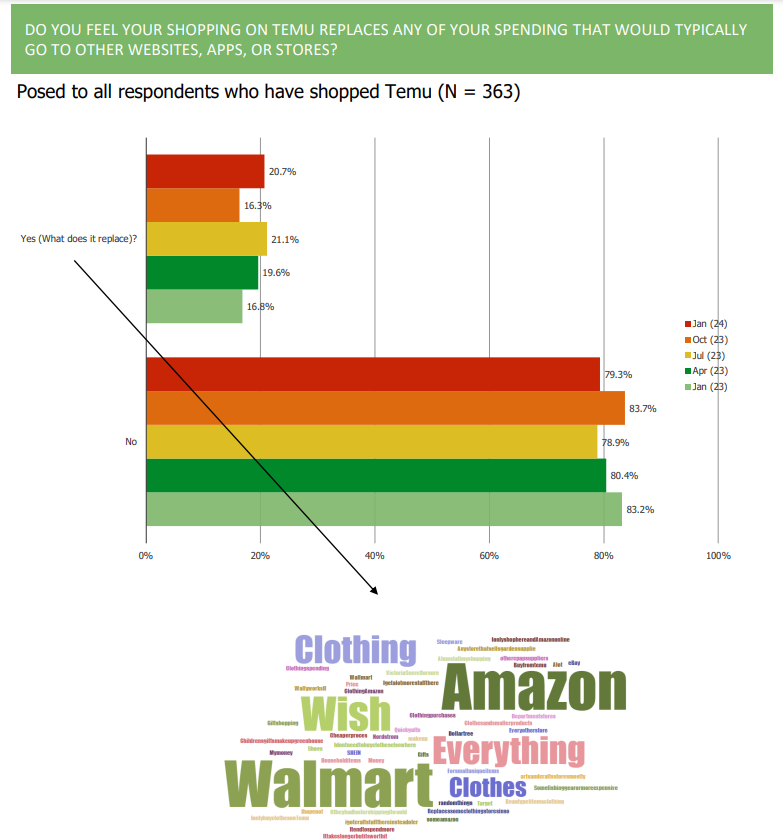
3. Most of those who have tried Temu do not feel as if it is replacing spending that would typically go elsewhere.
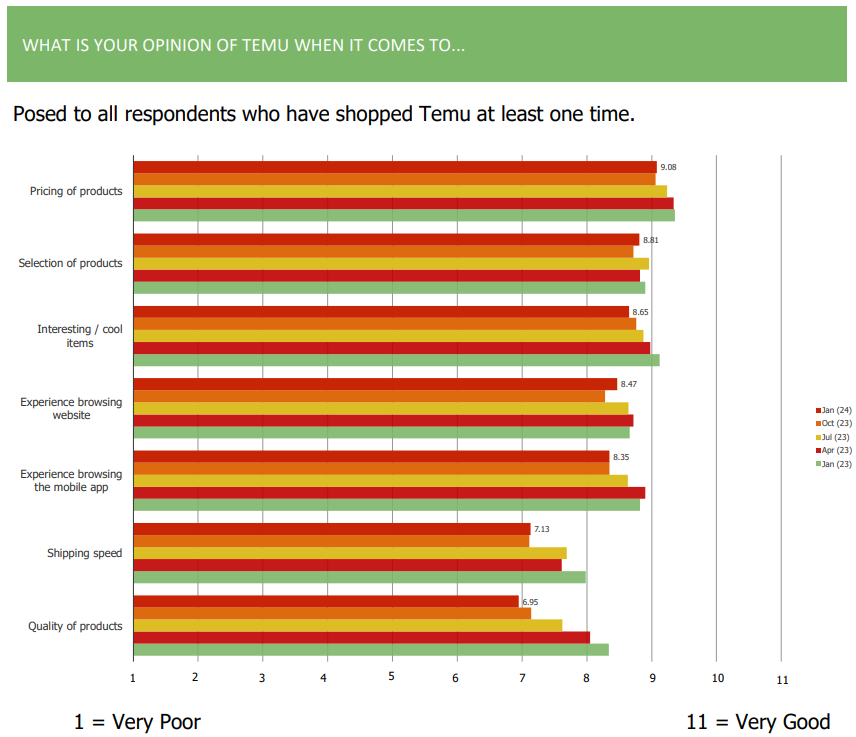
4. Diving deeper into individual Temu platform attributes, consumer satisfaction with pricing of and selection of products has been strong and mostly unchanged.
5. Broadly speaking, it appears that Amazon and Walmart are the most insulated from the Temu competitive threat.