Blog
Bespoke Survey Insights
(AMZN, W, TEMU) Online Retailers | Five Takeaways
1. Consumers self-report more discretionary confidence compared to our last wave in October of 2023. Feedback is still softer than series highs, but has improved q/q.

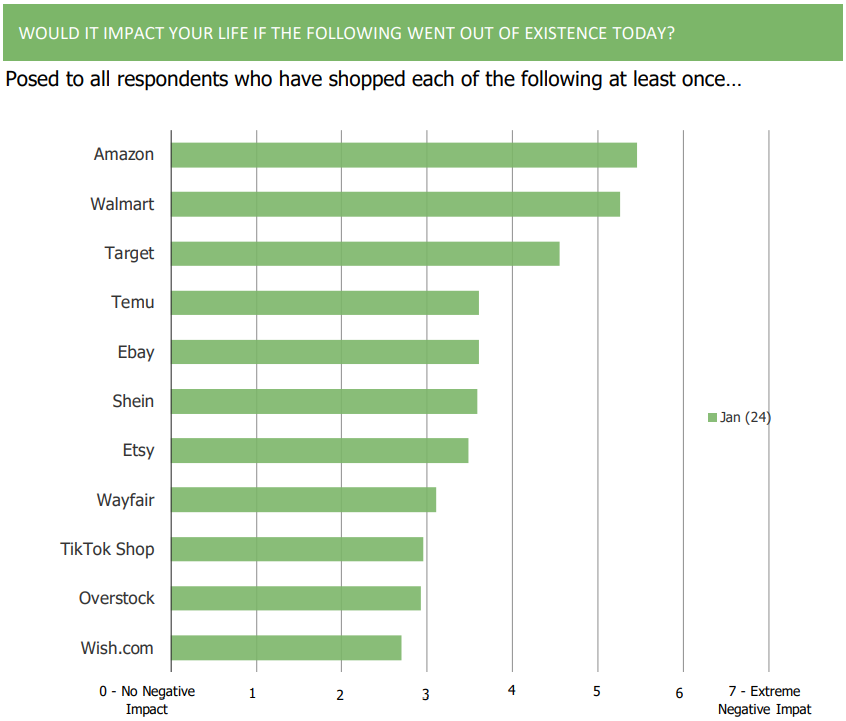
2. Among those who have used each of the retailers and etailers in our survey, Amazon is the customer base that would find it the most painful if the platform went out of existence today, followed closely by Walmart. Target ranks third on the list, followed by a cluster consisting of Temu, Ebay, and Shein
3. With regard to shopping frequencies, customers of Amazon, Walmart, Target, and Temu are the most likely to see their shopping as “regular” while shoppers of Overstock, Etsy, Wayfair, Wish.com, and Ebay are most likely to see their shopping as “episodic.”

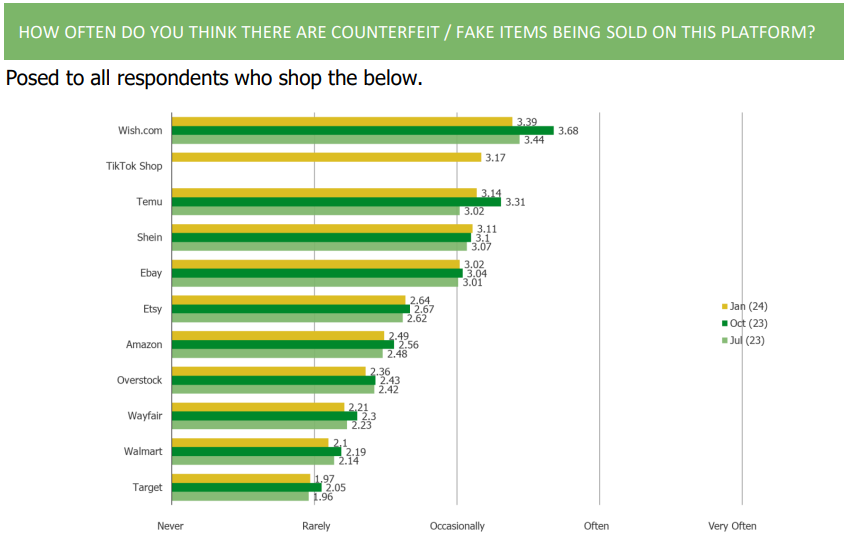
4. Respondents who shop platforms like Wish.com, TikTok Shop, Temu, Shein, and Ebay feel as if they encounter counterfeit and fake items more than users on other platforms. Trust is lower on platforms like Wish, Temu, TikTok Shop, and Shein relative to other etailers and retailers.
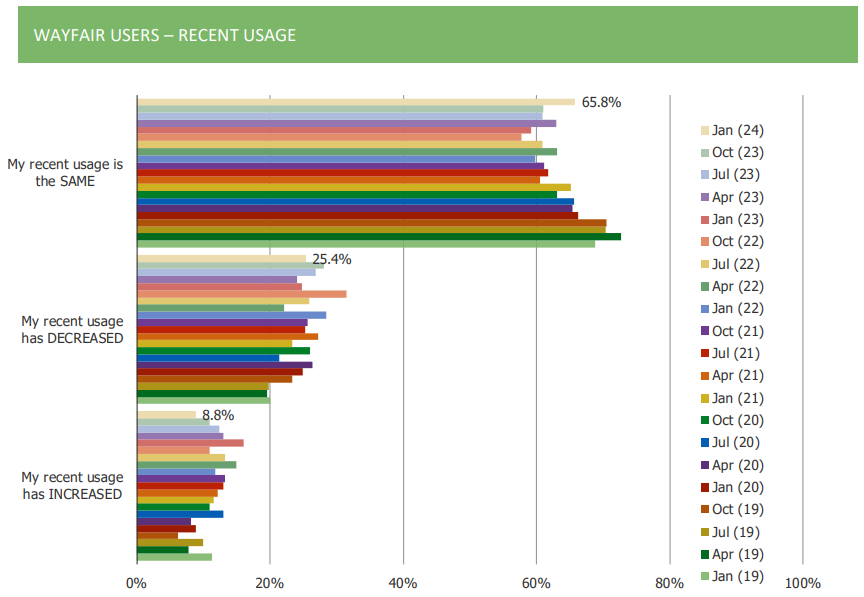
5. A number of tracking KPIs that ask about Wayfair have been flat to worse after reaching series highs during the pandemic.
(VVV) Oil Changes | Three Takeaways
1. A plurality of respondents prefer to get their oil changes done at the dealership (32.8%). Quick Lube shops ranked second, at 19.1%.

2. Among those who prefer Quick Lube Shops, a plurality would choose Jiffy Lube (34.3%) followed by Valvoline (23.8%). There is a large gap between the top two choices and the third (Firestone, at 7.2%).
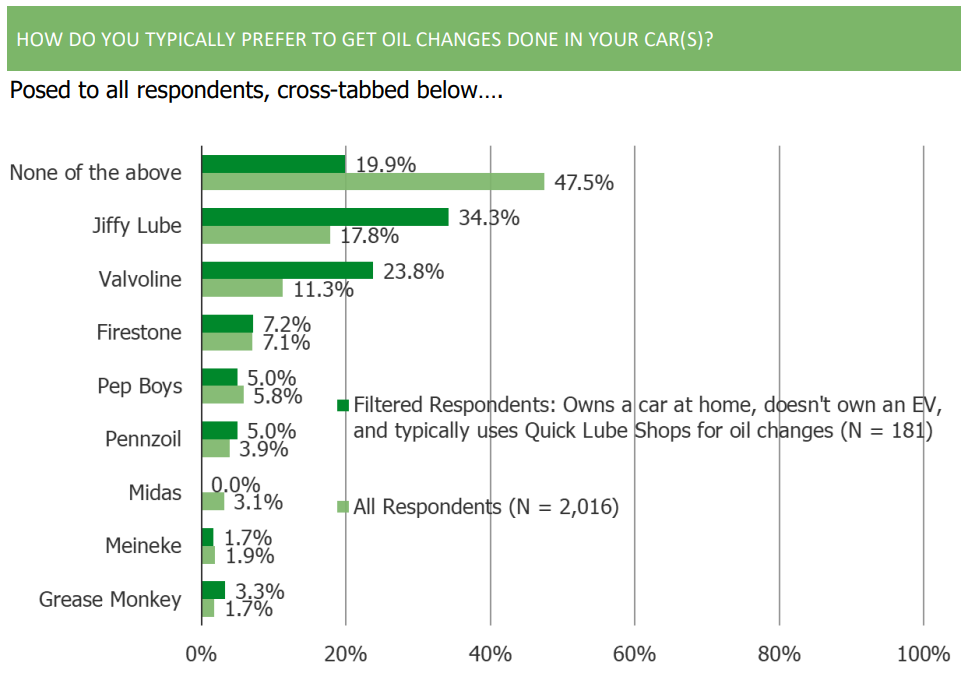
3. Respondents say they prefer Valvoline because of the location, how quick it is, because they like the brand, and because of the rewards.

(AAPL, MSFT, AMZN) Consumer Electronics | Five Takeaways
1. Consumers who use AI Chatbots describe a range of different activities that they use them for. A smattering of information, asking questions, entertainment, and work or school related help.
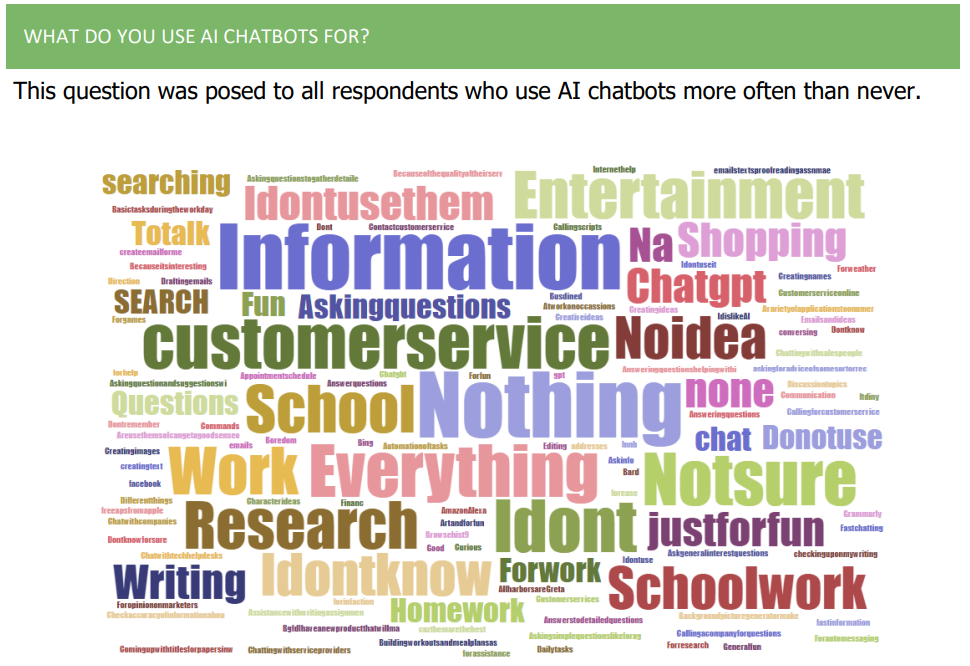
2. Based on our reading of fill-in responses, there is a mixture of hope for possible applications around AI and caution/fear around possible risks that could materialize from AI.

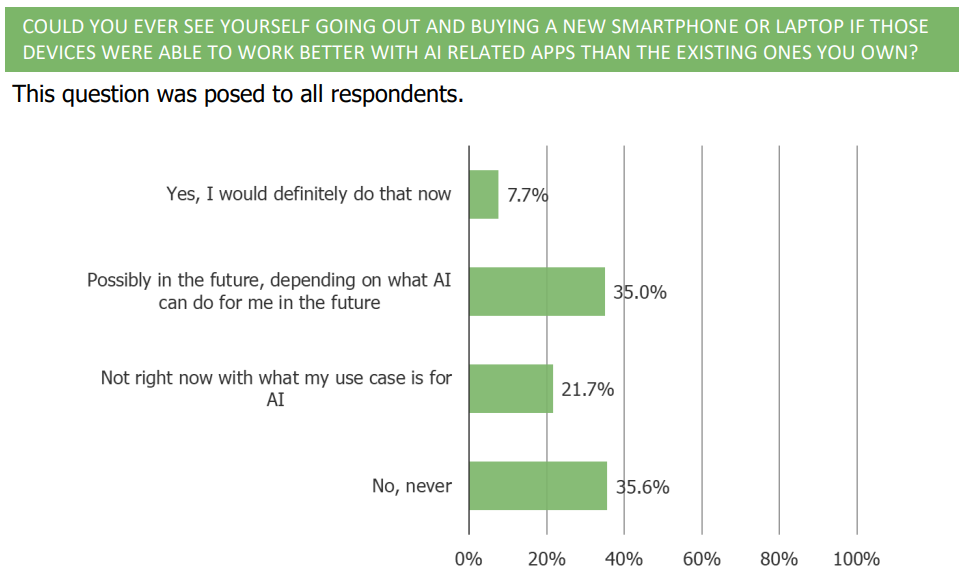
3. A relatively low percentage (7.7%) of consumers said they would buy a new
smartphone or laptop today if those devices worked better with AI related apps. At the
same time, only 35.6% said they would never do that. In between, the majority of
respondents either said possible in the future depending on what AI could do for them
(35%) or not right now based on their current use case for AI (21.8%).
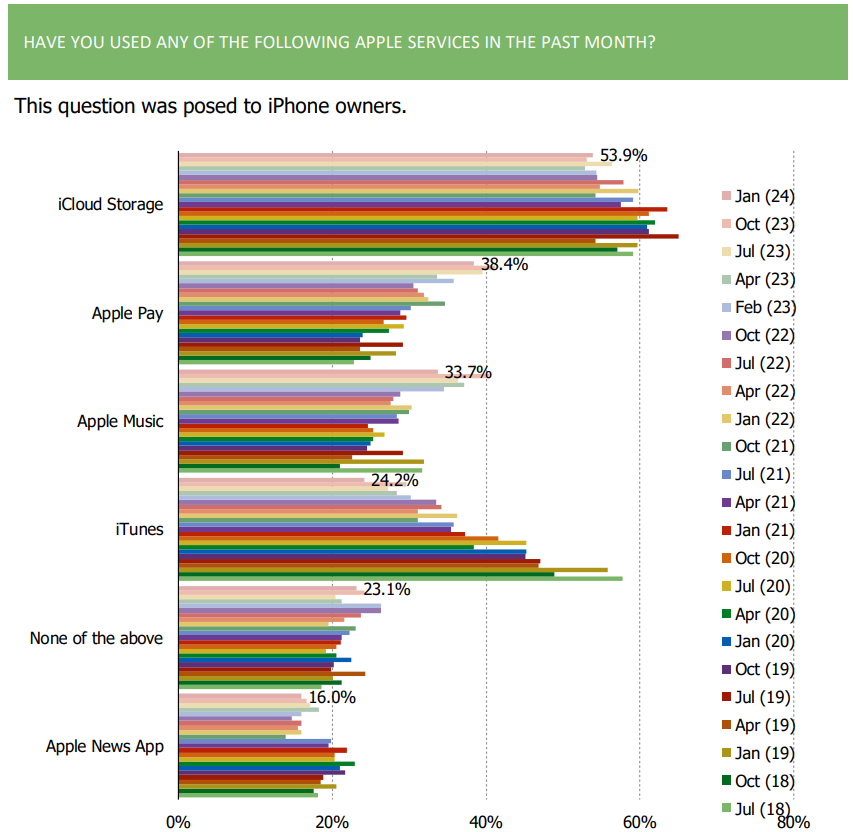
4. The share of iPhone users who utilize Apple Pay and Apple Music has increased
considerably over the history of our survey.
5. Over the past year in particular, our survey has detected an improvement in sentiment toward Apple (overall, willingness to pay a premium for their products, etc).

(TSLA) Autos & Electric Vehicles Survey | Five Takeaways
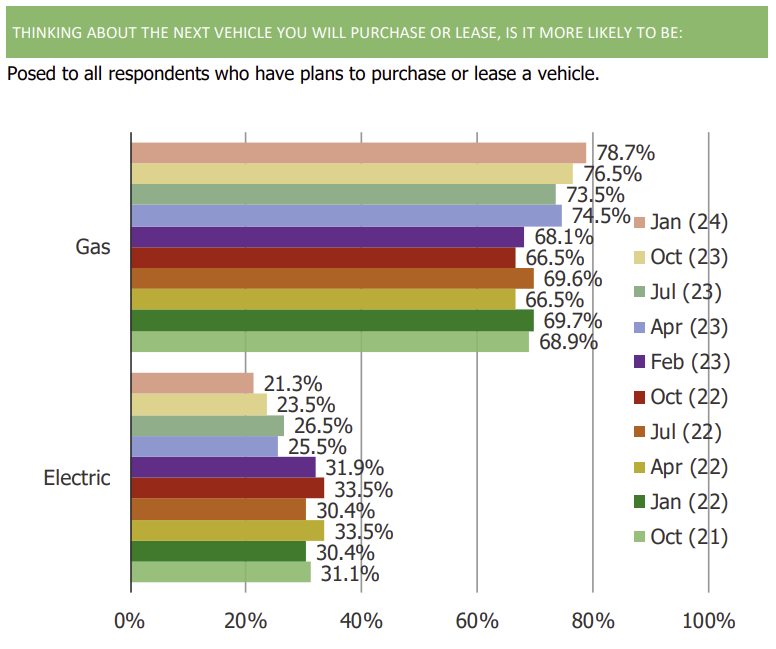
1. Intentions to purchase an electric vehicle for their next vehicle purchase continue to move lower (currently sits at a series low).
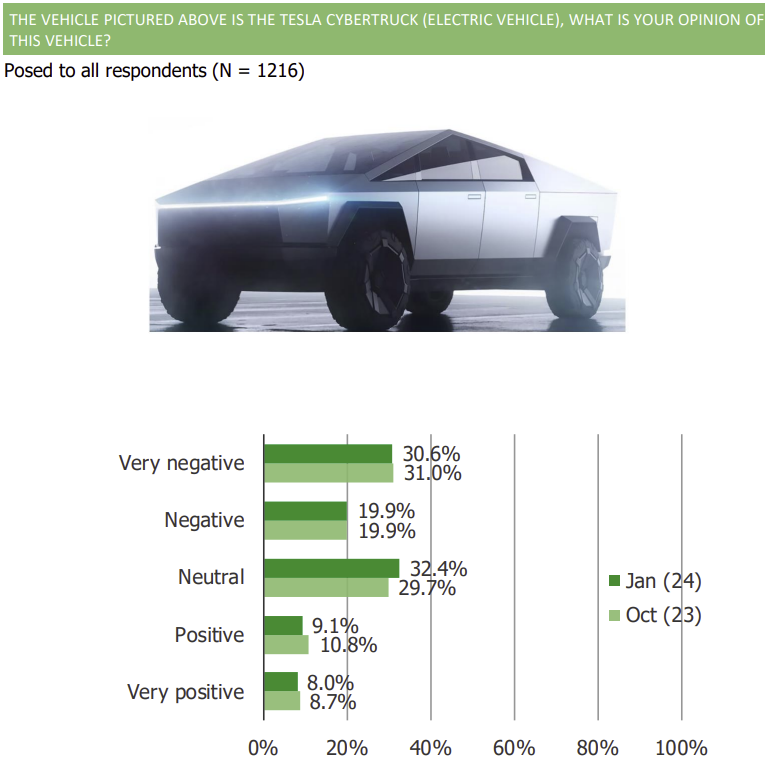
2. Consumer opinions on the Tesla Cybertruck continue to skew neutral to negative.
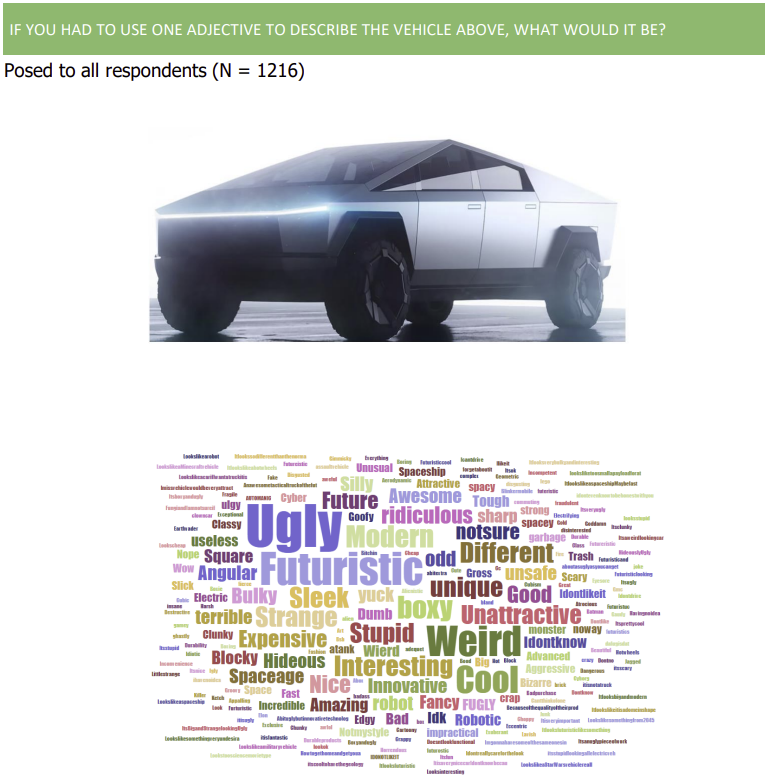
3. In fill in responses, consumers wrote that they associated the Tesla Cybertruck with the words “ugly,” “boxy,” and “futuristic.”
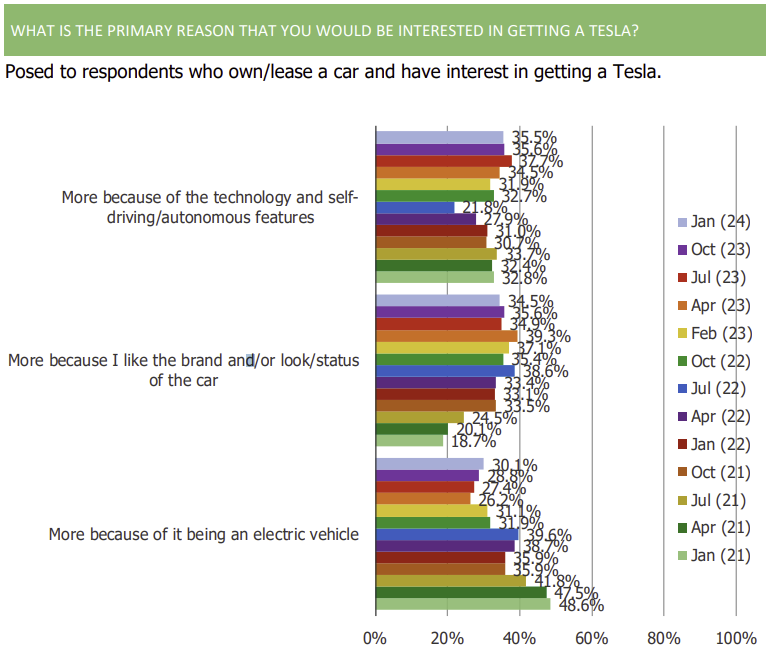
4. Among those who said that they are interested in getting a Tesla, the share who said they are interested because it is an electric vehicle has declined over time. During the same period, the share who are interested in the tech and car features increased.
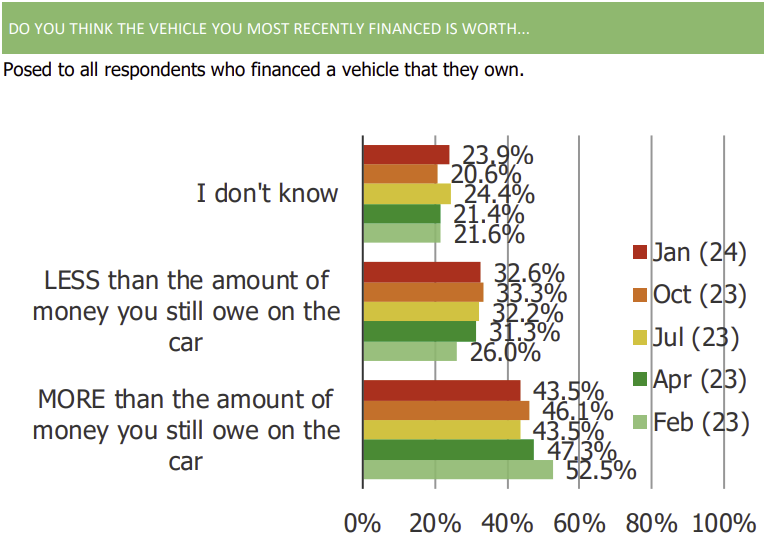
5. Over the past year, the share of those who own a car who think that their car is worth less than the amount they have left to pay on it has increased.
(PTON) Fitness Survey | Five Takeaways
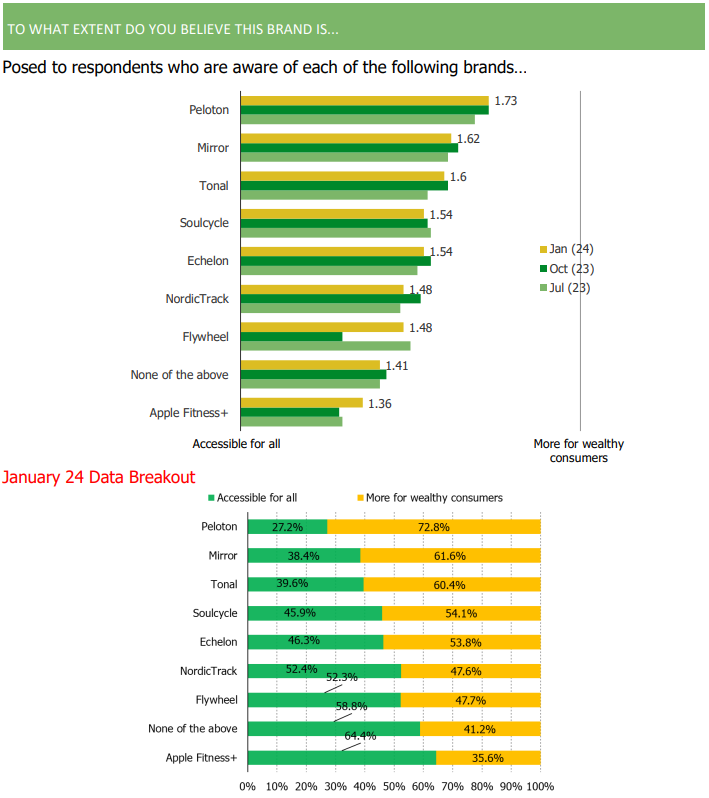
1. Consumers continue to view the Peloton brand as a brand that’s more for wealthy consumers than for all. The sentiment has been more flat/unchanged q/q.
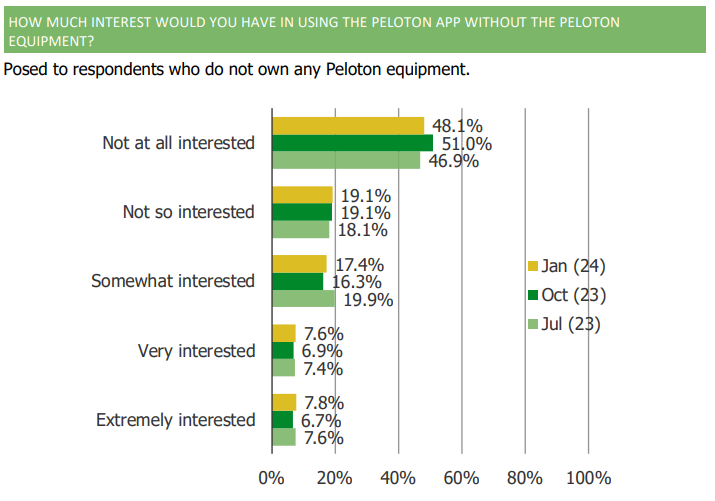
2. Among those who aren’t currently customers of Peloton, the majority don’t have interest in app-only access.
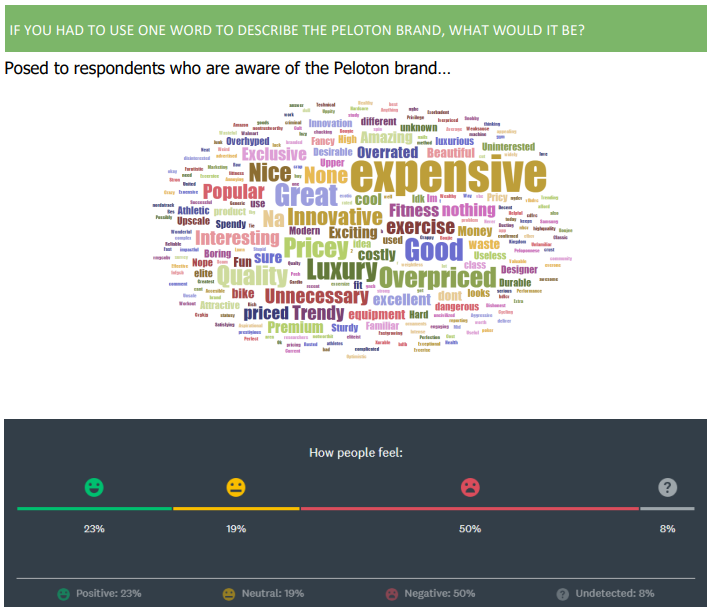
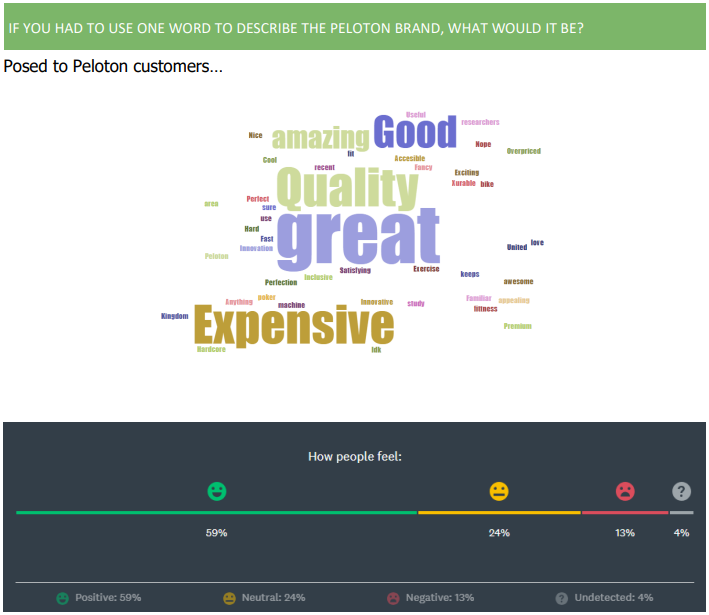
3. There is a large delta in sentiment readings towards Peloton by respondents who are customers of the brand vs. respondents who are just aware of the brand. Customers love it, but those who aren’t customers view it as expensive, overpriced, and luxury.
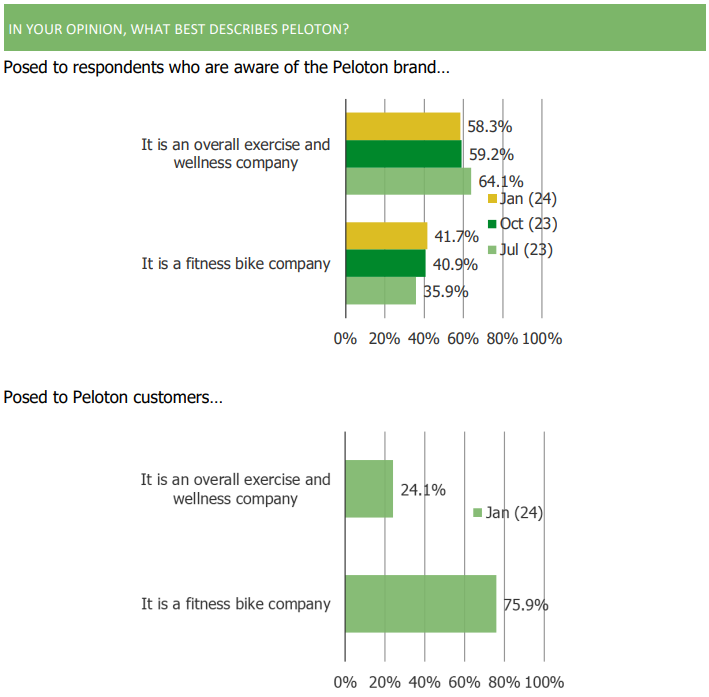
4.Peloton customers are more likely to see Peloton as a fitness bike company while the broader population views it more as an exercise and wellness company.
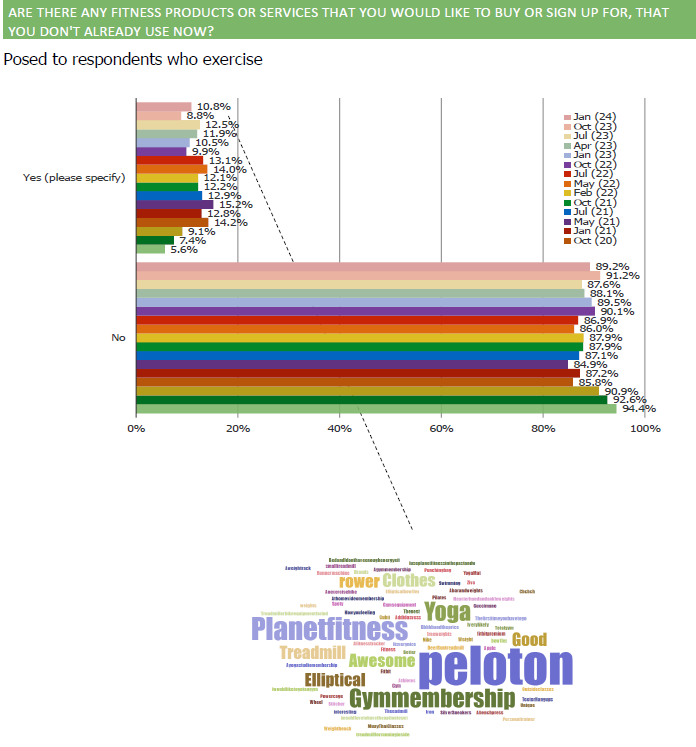
5. Consumer interest in at-home fitness brands/products peaked during the pandemic and readings remain lower at the moment compared to that peak.
(SN) SharkNinja Survey | Three Takeaways
1. Sentiment toward both Ninja and Shark brands among consumers is very positive on an absolute basis and on a relative basis compared to peers
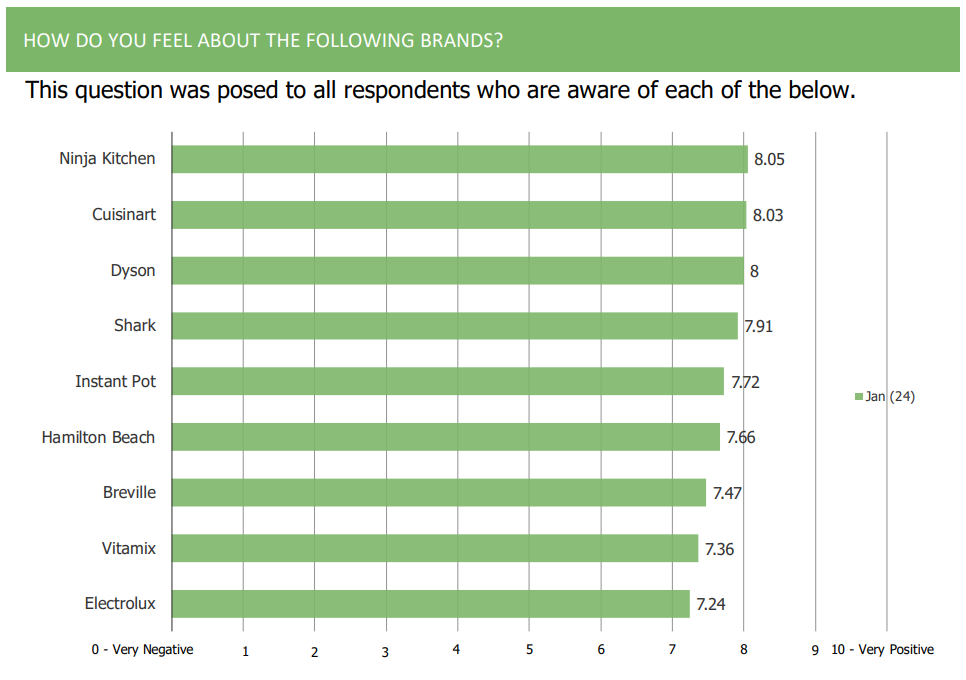
2. Ninja Kitchen has an NPS of 45.2 and Shark has an NPS of 36.6
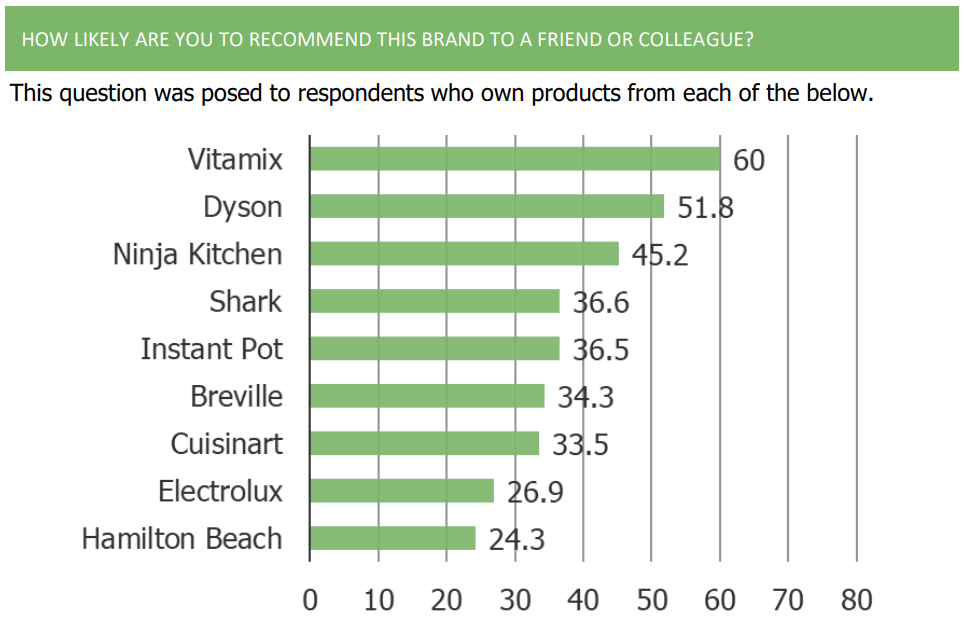
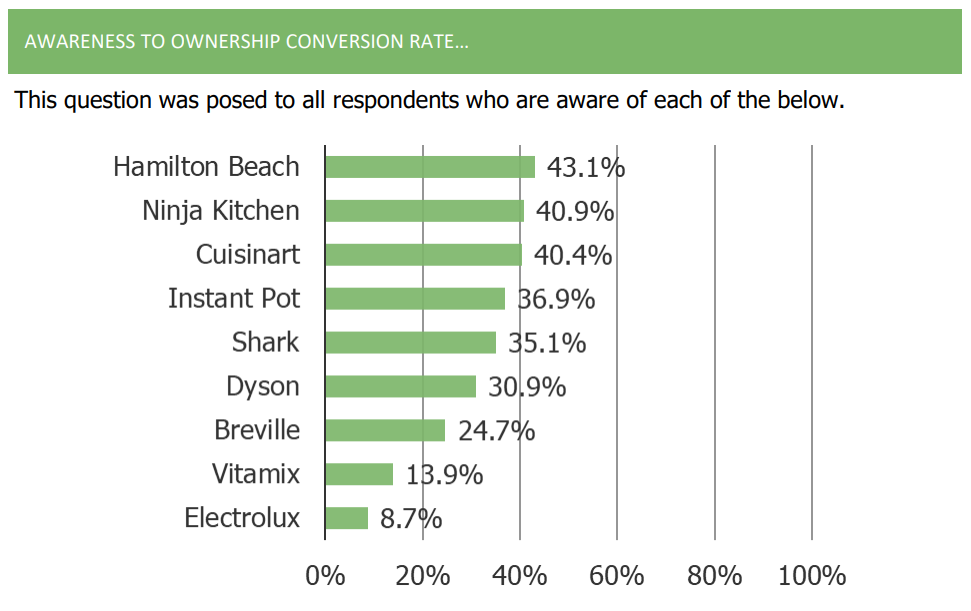
3. Both Shark and Ninja are at the higher end of our rankings when it comes to awareness ownership conversion rate (ie, % of those who are aware of the brands who own products from the brands)
(NFLX) Quarterly Survey, Volume 43 | Five Insights
Highlighting five interesting takeaways from our 100+ page survey report on Netflix. If you are a client, login to view the full report. If you are not a client and want to learn more, email [email protected] or call 914-630-0512.
1. Consumer sentiment regarding Netflix is very positive, trailing only YouTube and Amazon, and ahead of a number of the other brands that we ask about including Paramount+, Disney+, and Apple TV+

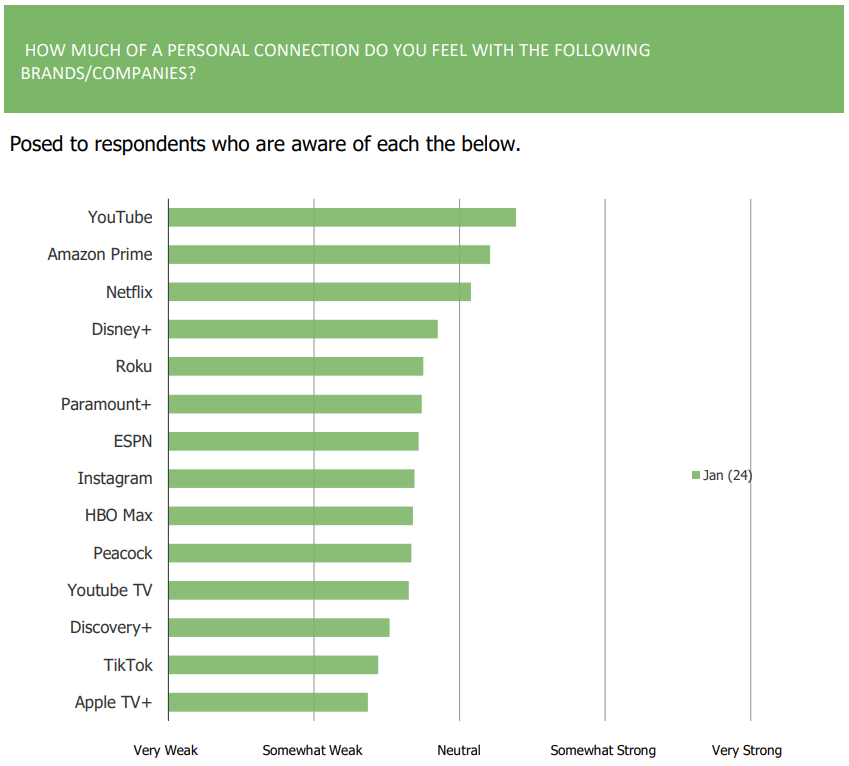
2. Consumers feel more of a personal connection to Netflix relative to other brands including Disney+, Roku, ESPN, Roku, and Peacock, to name a few
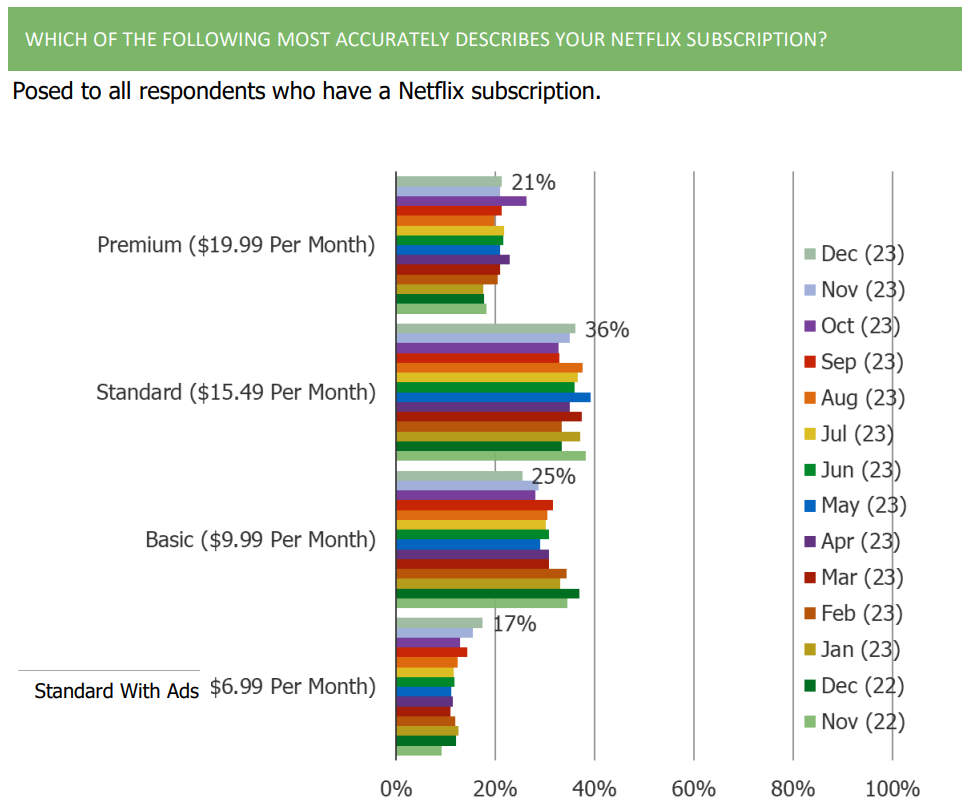
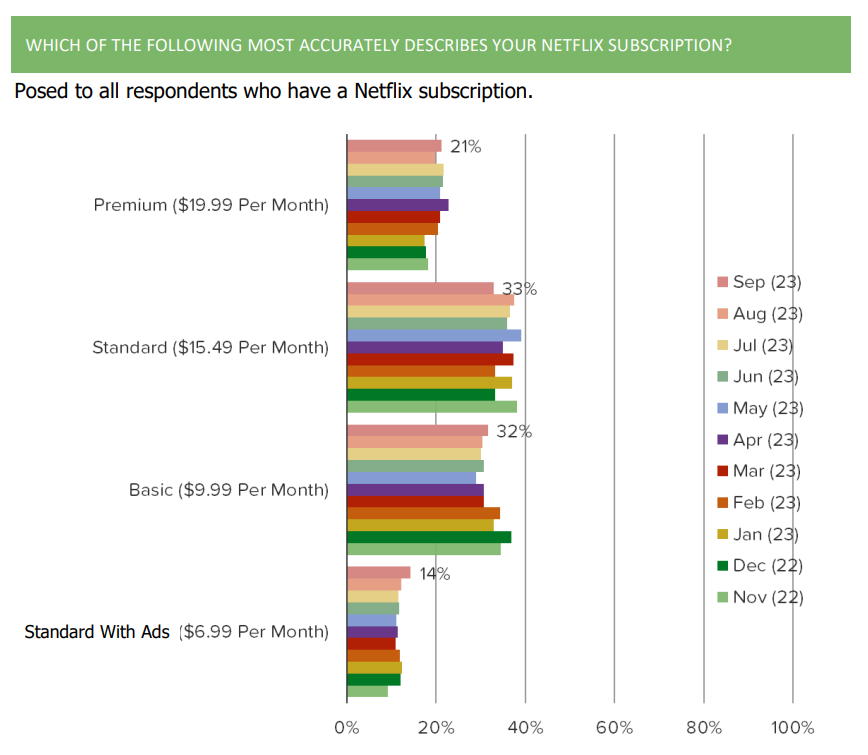
3. The percentage of respondents who are on the Netflix Standard with ads subscription continues to increase
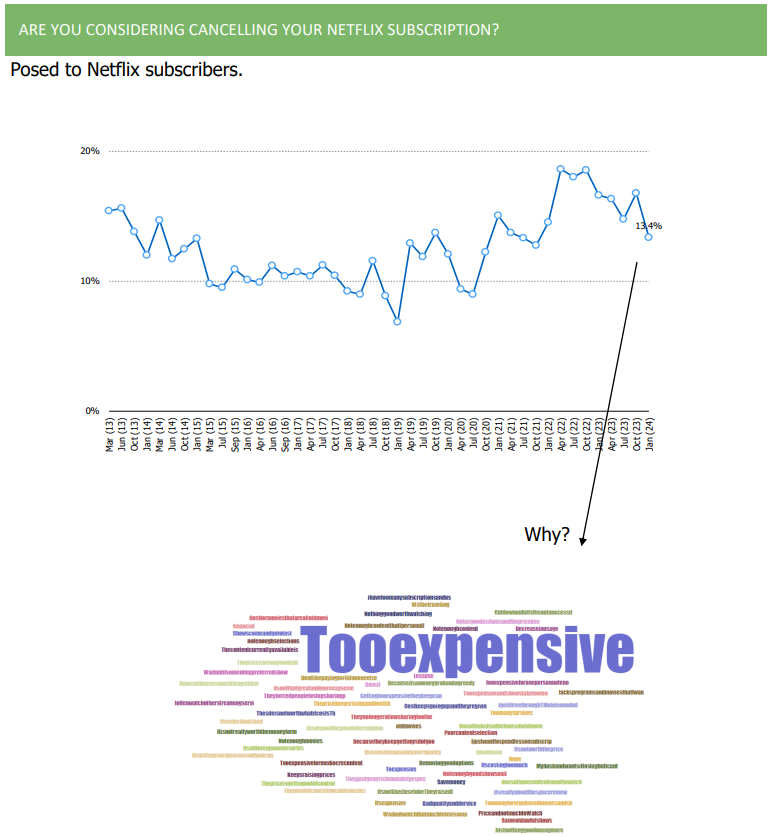
4. The share of Netflix subscribers considering cancelling at the moment declined sequentially. Those who are considering cancelling complain about price / say it’s too expensive
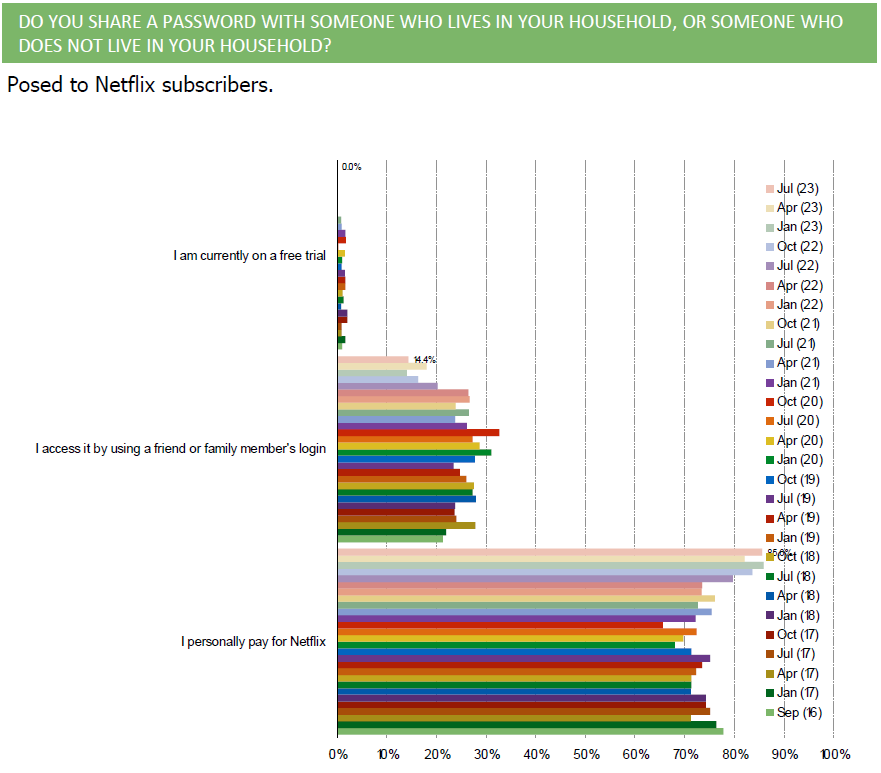
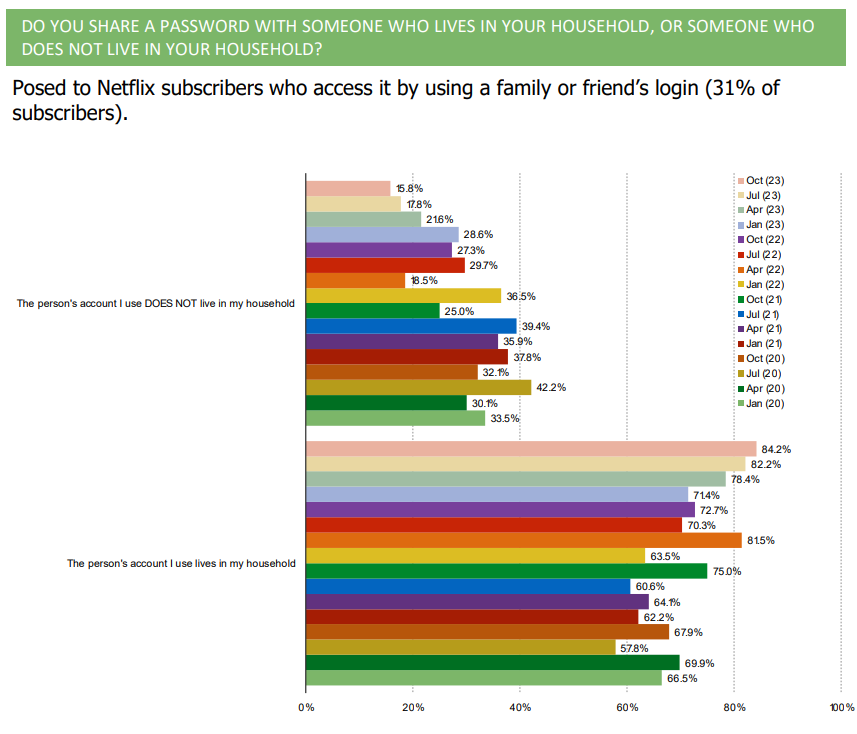
5. The share of Netflix watchers who had trouble accessing the account of someone they don’t live with (in the past month) increased for two consecutive waves since we started asking the question in July of 2023.

Streaming Video, UK (NFLX)
Key Takeaways:
- Streaming video has gained as the preferred method for consuming TV and film content over the history of our survey.
- The share of consumers who subscribe to cable, satellite, or telco television has declined over the history of our survey. An increasing share of those who do not have cable TV said they cancelled to use internet streaming services instead.
- Interest in ad-supported streaming platforms has grown sequentially over the past 4-6 quarters.
- Most of the engagement related topics on Netflix are consistent with what we observed in recent prior waves.
Full Report:
(SPOT, SIRI, AAPL, GOOG) Top 5 Takeaways From Audio Survey
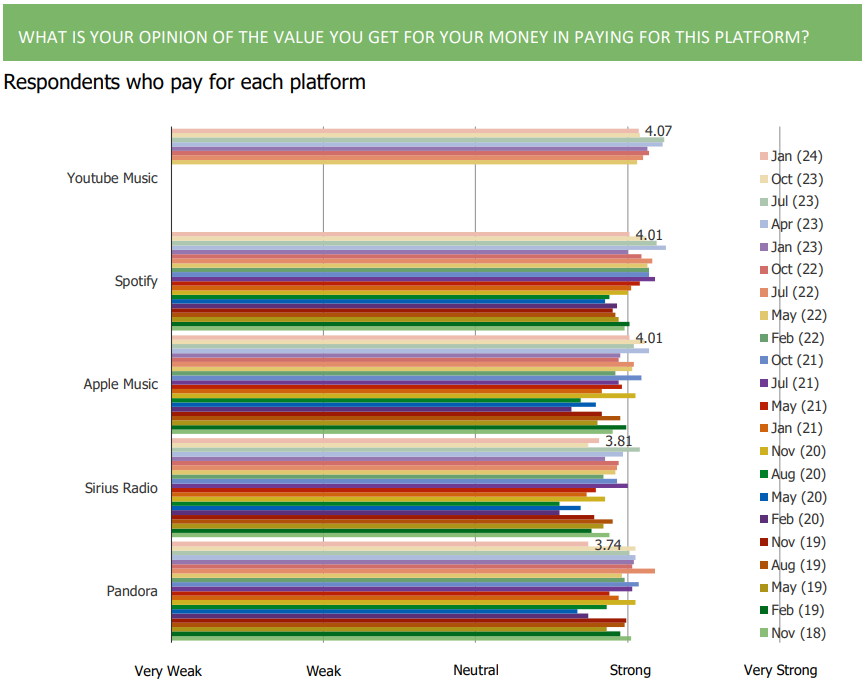
1. Sentiment based feedback toward both YouTube Music and Spotify remains positive
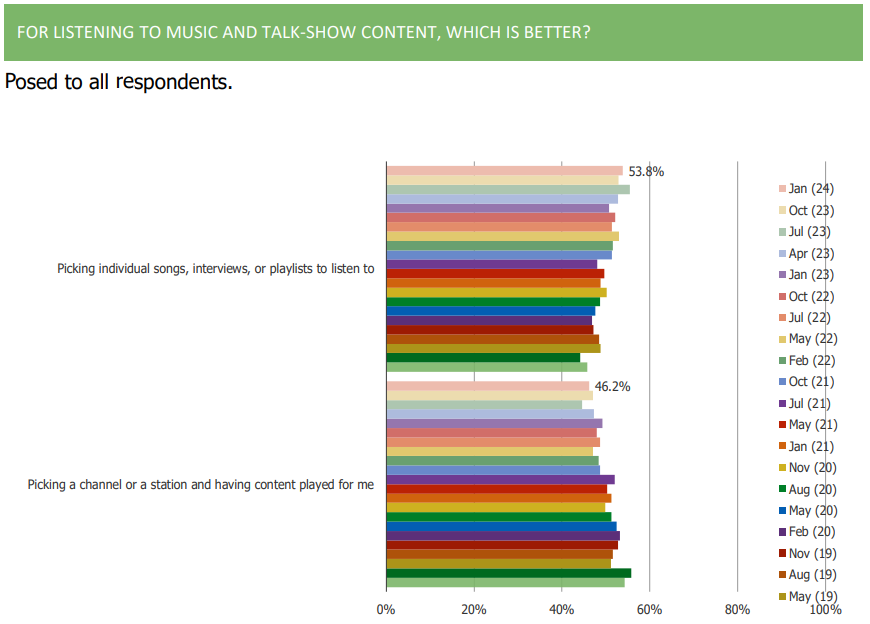
2. Consumers continue to shift their preferences toward picking individual song, interviews or playlists to listen to and away from picking a channel or station and having it play content for them
3. Sirius App Revamp: Consumers offer net-positive feedback around the design and interface of the revamped Sirius app. Among those who report having downloaded the app, feedback was generally positive (4.2 stars)
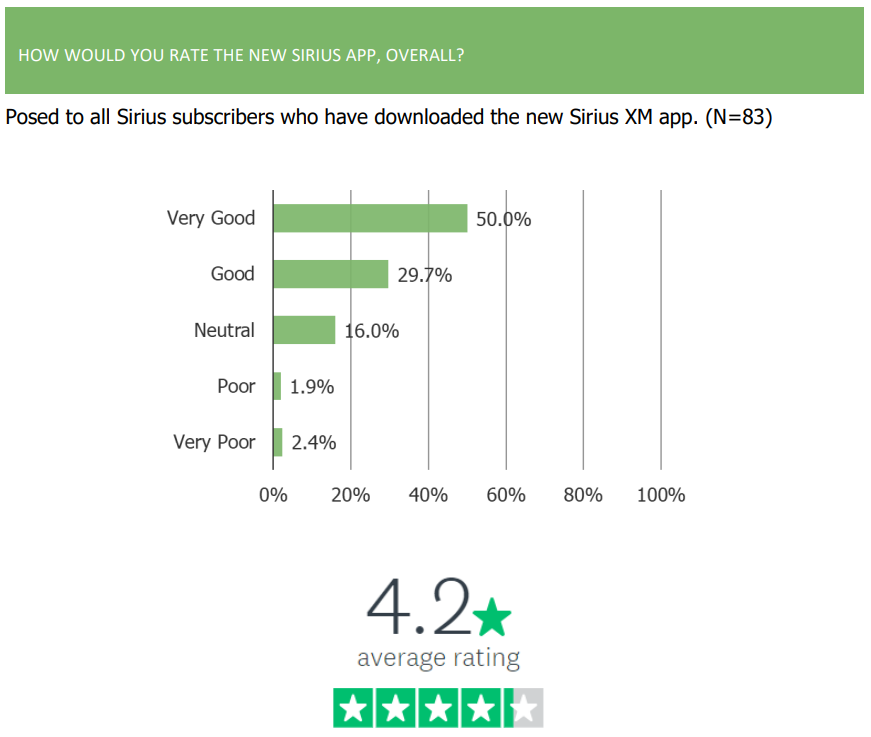
4. While consumers offered generally positive sentiments on the Sirius App – commentary on content on the app was more positive than commentary on interface

5. Among streaming music users, the top catalysts for choosing apps include ease of use, variety, price, and no ads

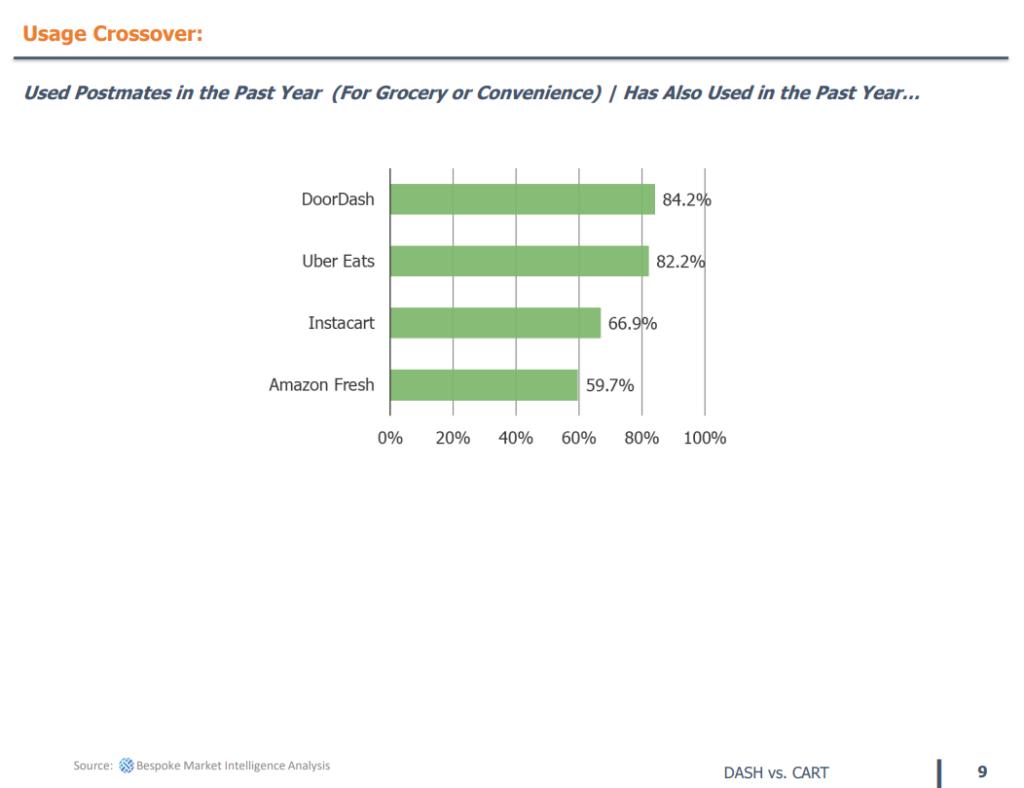
Top 5 Takeaways From Our Food Delivery Survey
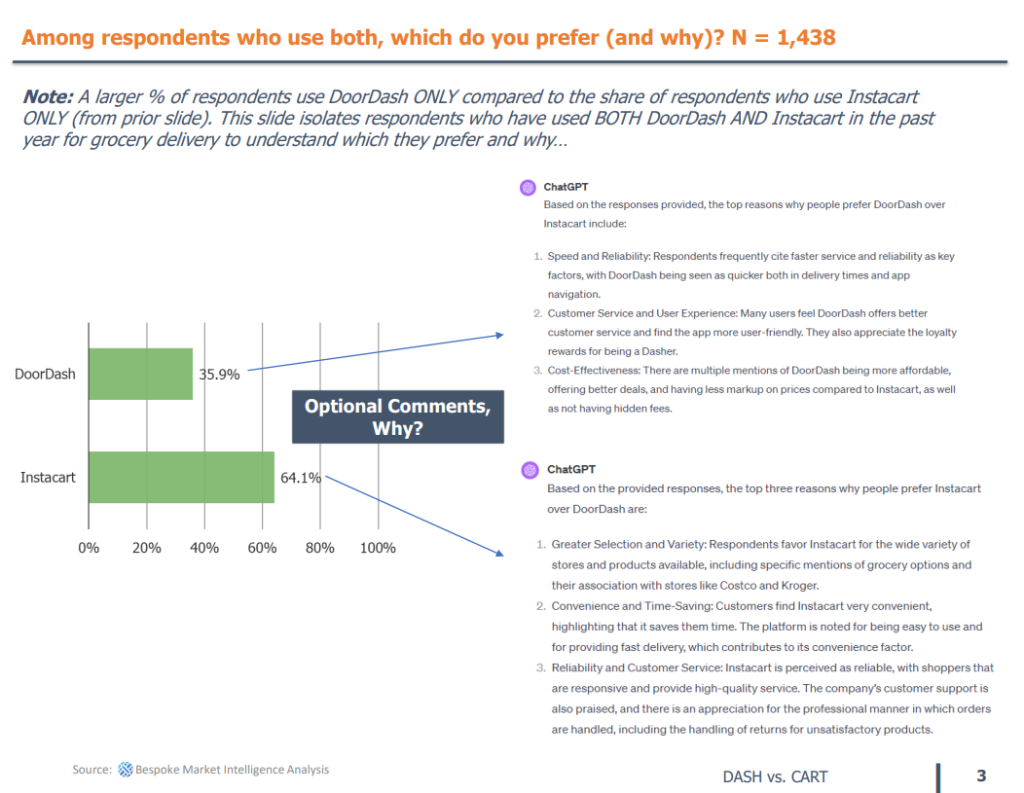
5. Consumers who use both both apps continue to prefer DoorDash over Uber Eats
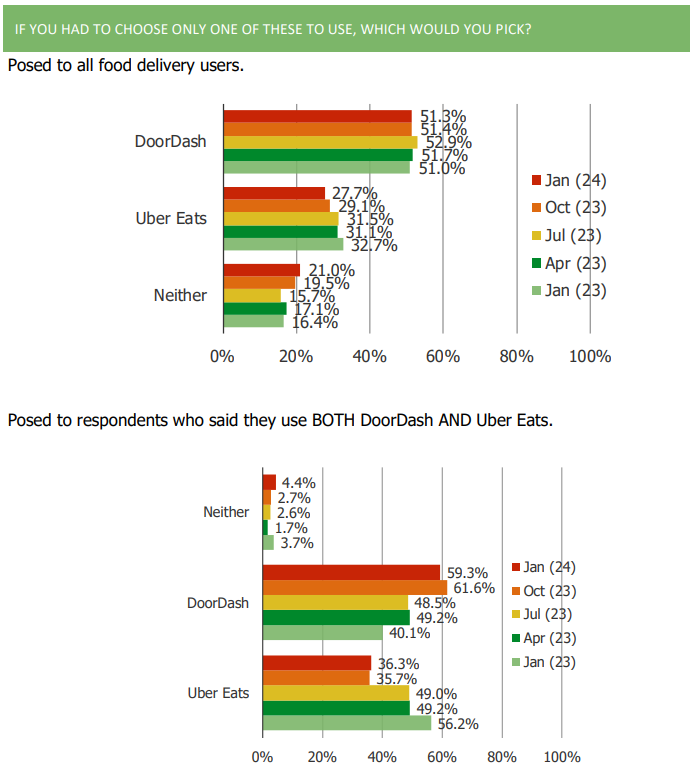
4. DoorDash continues to be the top app that consumers use regularly or occasionally when ordering takeout food delivery

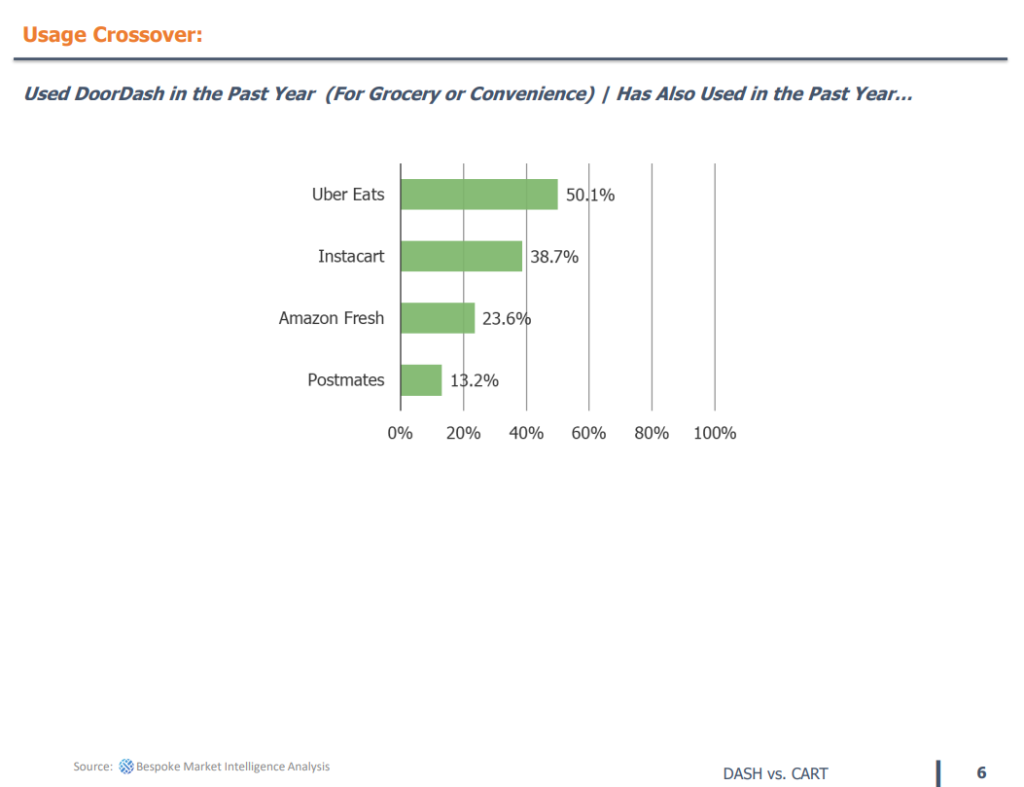
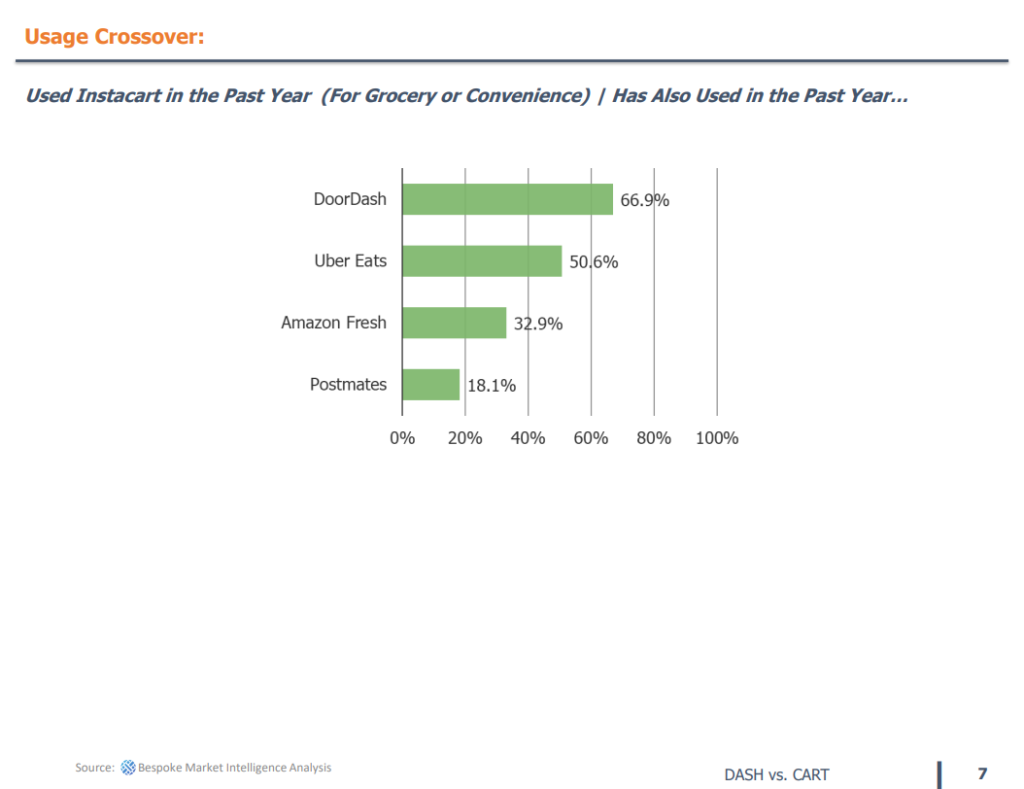
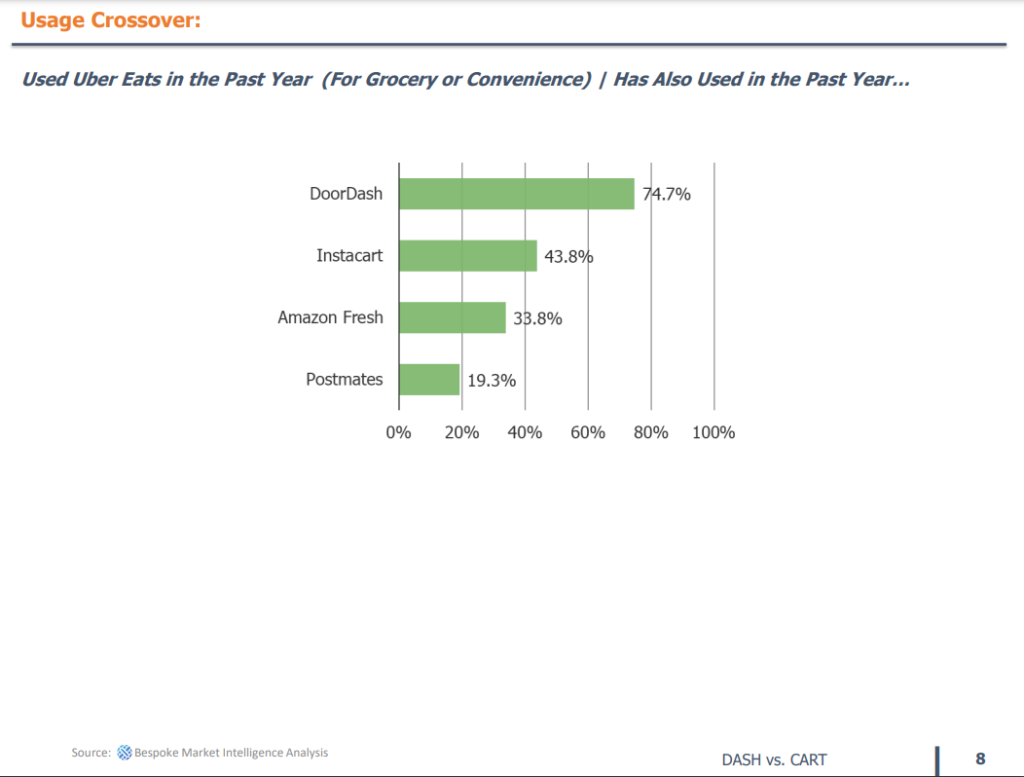
3. DoorDash has gained share in our survey across historical waves (i.e., an increasing share of users of the competition are also using DoorDash and a declining share of DoorDash users are also using the competition)

2. Self-Reported food delivery app usage has declined q/q and usage frequency among those who use food delivery softened sequentially in our survey
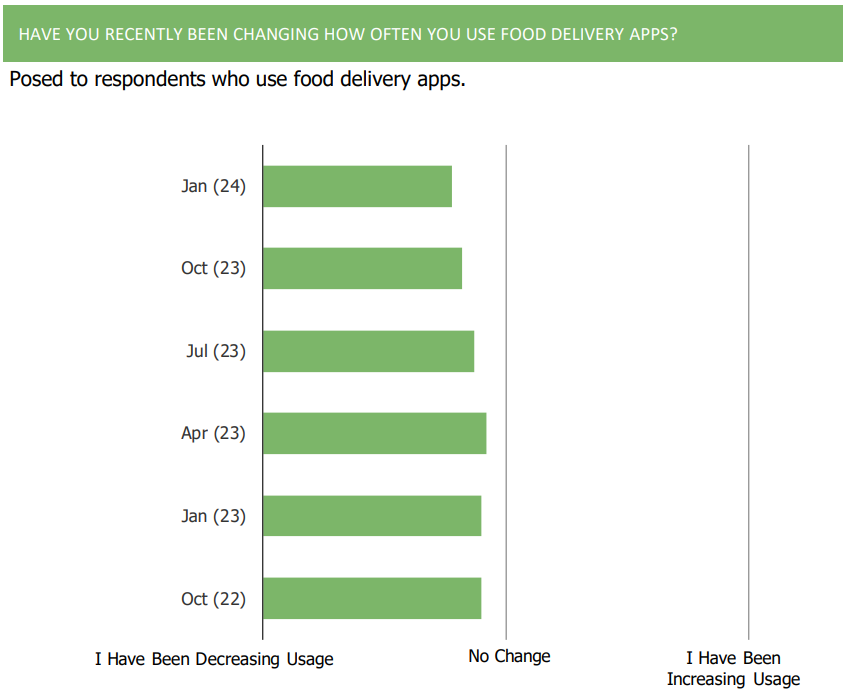
1. Among those who are using food delivery apps less frequently, the top reasons for reducing usage are nearly all related to cost and spending concerns.

NFLX | Five Takeaways Directly From Subscribers
Are people actually sharing their Netflix accounts less?
That was one of dozens of client questions we sought to answer in the 42nd volume of our quarterly streaming video survey. As we look forward to the 43rd volume of our streaming video survey due for release later this week, we look back at some helpful findings from our October survey.
Contact us for more info about how to get access to volume 43 to see how the data changed compared to three months ago ([email protected]).
Takeaway 1: Netflix subscribers indicate a reduction in account sharing
Takeaway 2: The share of Netflix subscribers on the Standard with Ads plan ticked up slightly over the course of the year, but remains the least popular option based on survey responses.
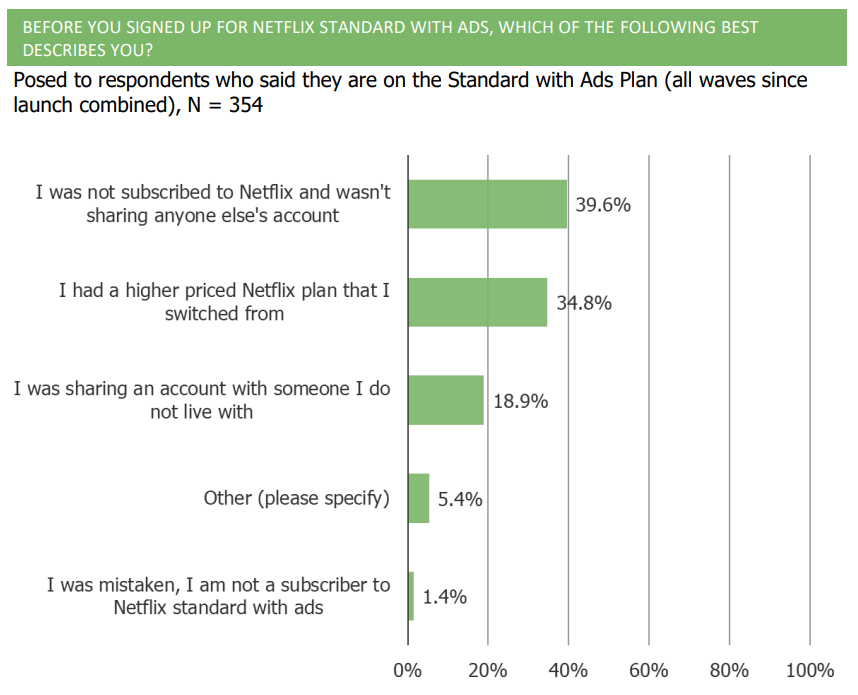
Takeaway 3: Of respondents on Standard with Ads, 18.9% said that they were sharing an account with someone they do not live with before they signed up. 39.6% said they were not previously accessing Netflix in any way and 34.8% said they were on a higher Netflix plan.
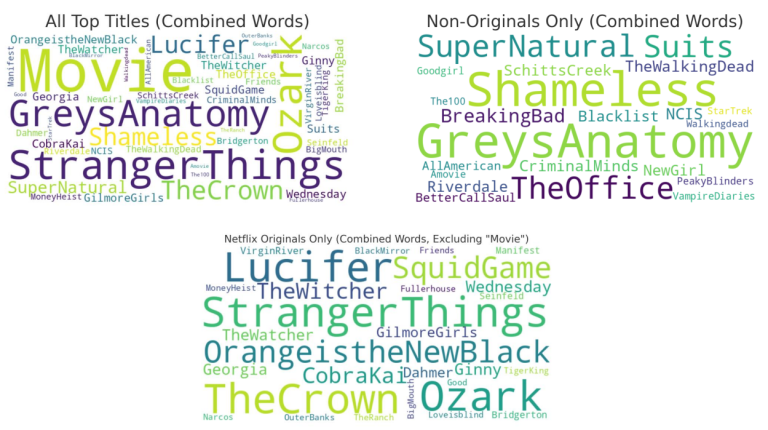
Takeaway 4: Originals are a big part of the Netflix viewing experience.
For this analysis, we uploaded 32,000 fill-ins across 40+ monthly waves to ChatGPT 4.0 along with a database of 3200+ titles of Netflix originals and asked ChatGPT to tell us what percentage of the last things watched by respondents each month were originals vs. non-originals.
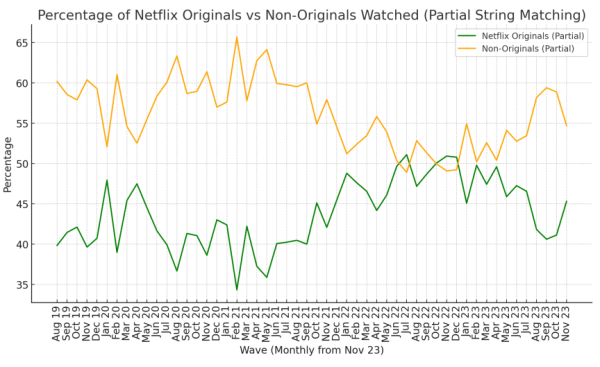
When we asked ChatGPT to list the top titles mentioned and then asked it to cross-reference the originals database to label each as either original or non-original, 7 out of the top 10 names listed were Netflix Originals, with Stranger Things far and away taking the top spot.
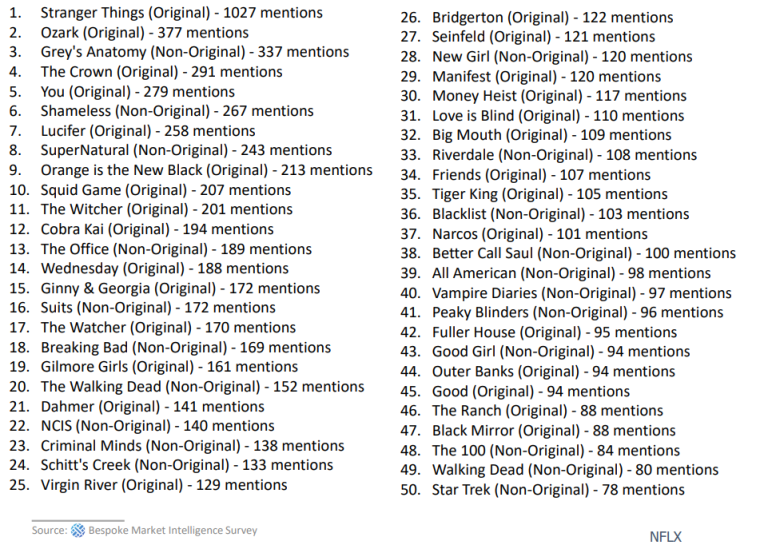
We then asked ChatGPT to create word clouds of titles by category across all 32k+ fill-ins.
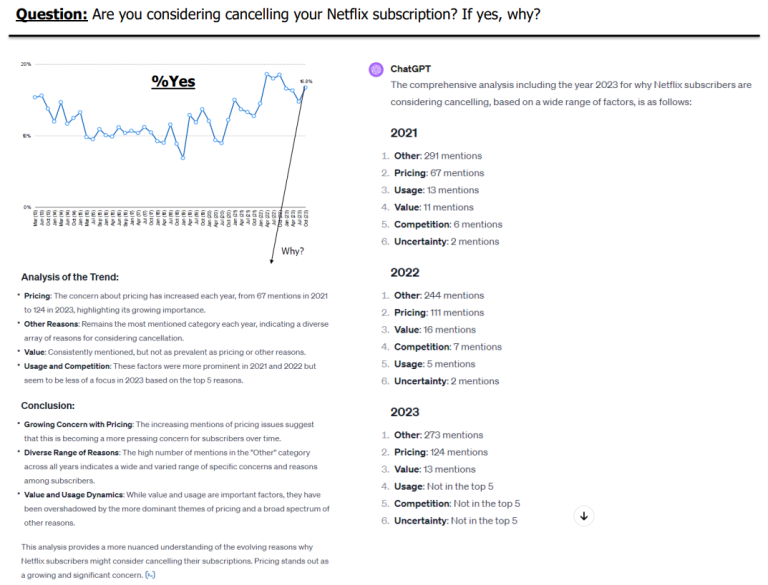
Takeaway 5: Pricing is an ever-present concern among respondents contemplating churning.
When asked if they were considering cancelling their Netflix subscriptions, 16.8% of respondents said yes, with pricing being their top concern. This concern with pricing has increased every year since we began asking this question, from 67 mentions in 2021 to 124 in 2023.
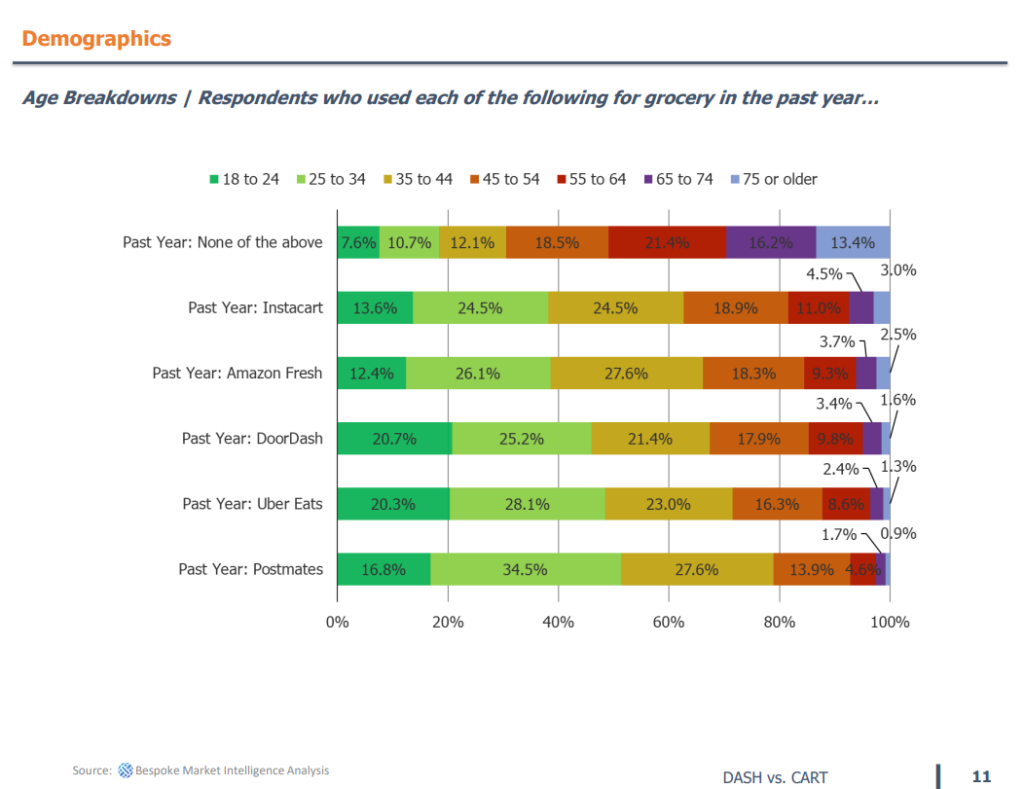
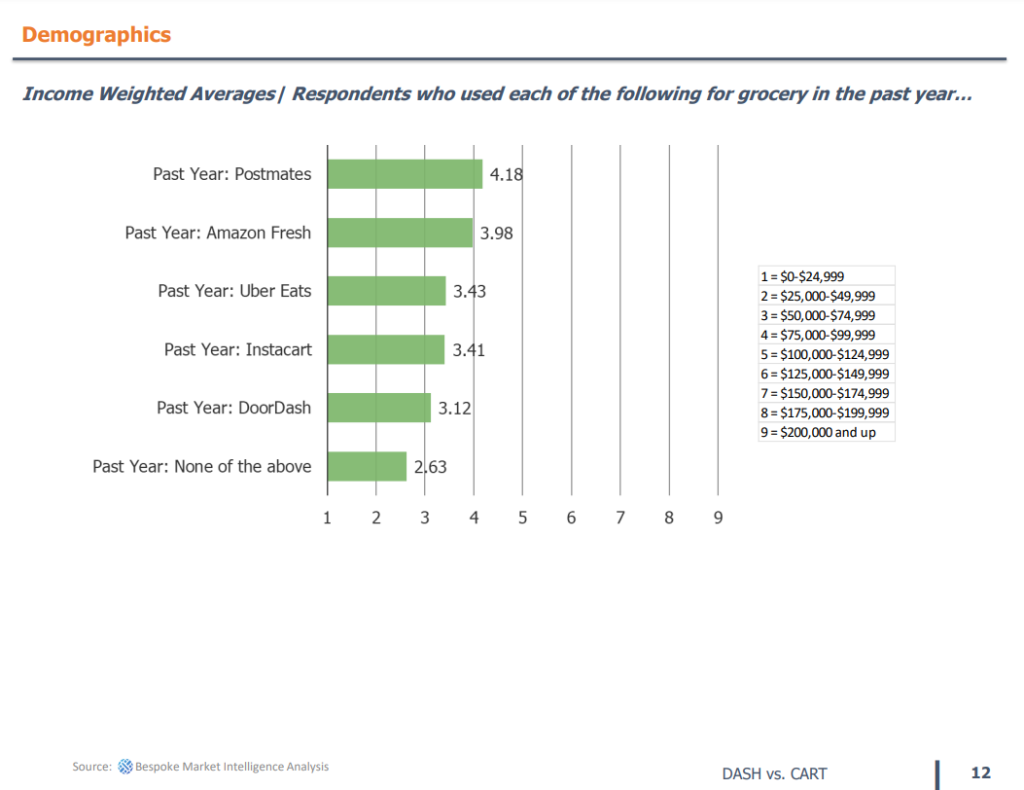
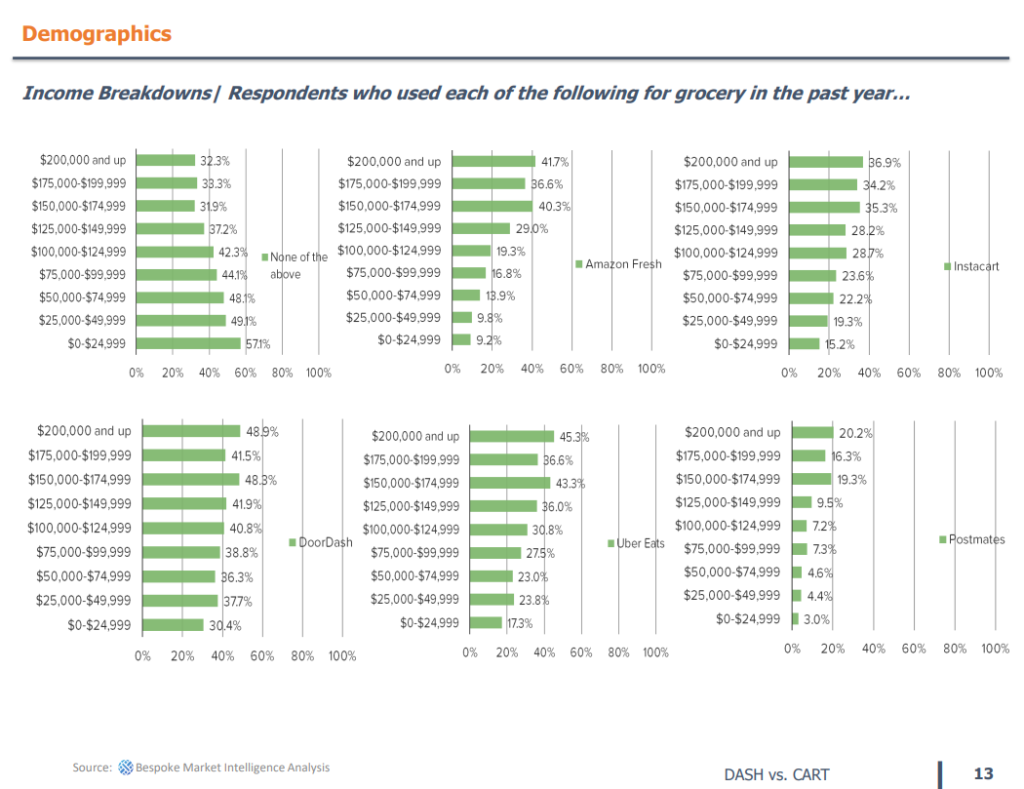
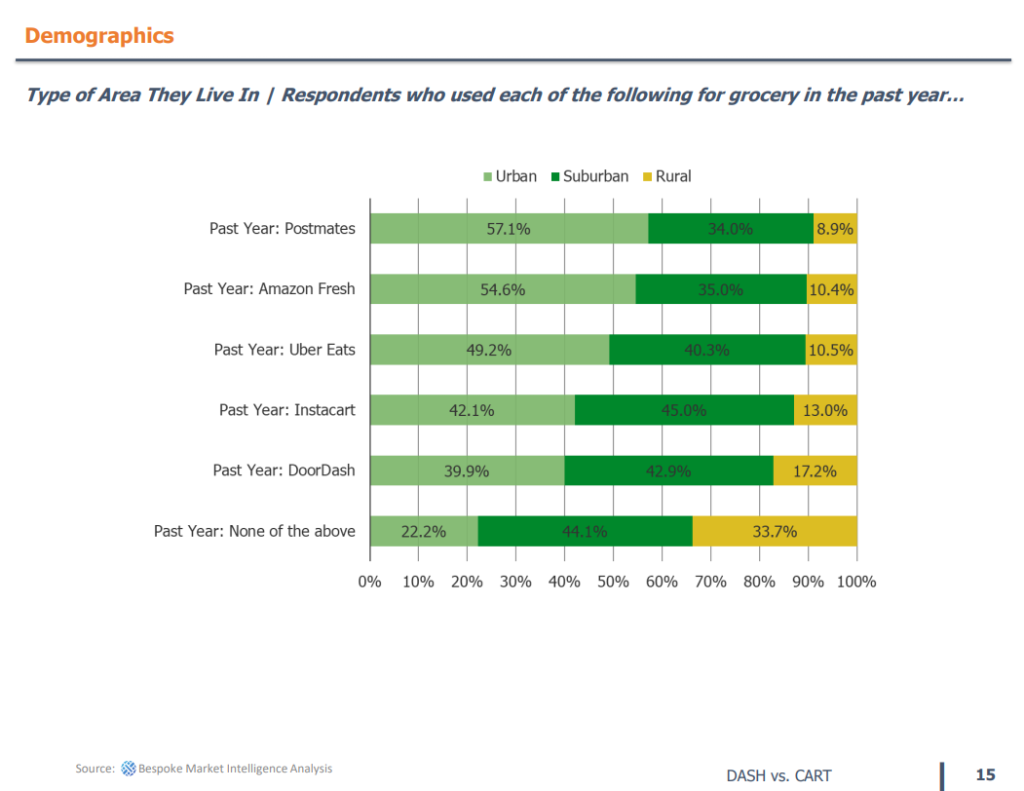
DASH vs. CART | Custom Survey