Blog
Bespoke Survey Insights
(AAPL) iOS 18 Excitement and AI
Below are charts from the 46th volume of our AAPL consumer survey work in the US (we run AAPL surveys in China as well).
AAPL has come into focus as a topic of increasing interest with the buyside recently. Start a free trial with us to see all pages from wave 46 and to follow where this data goes when we run volume 47 in two weeks.
If you are a client, log-in to view the full report.
Takeaways:
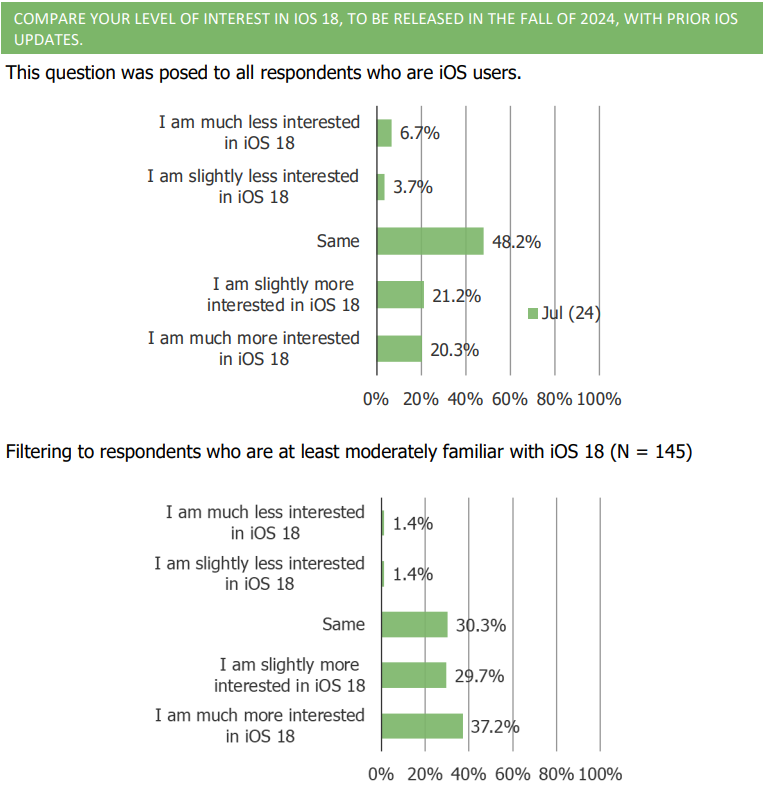
- People say they are more excited for iOS 18 than prior updates.
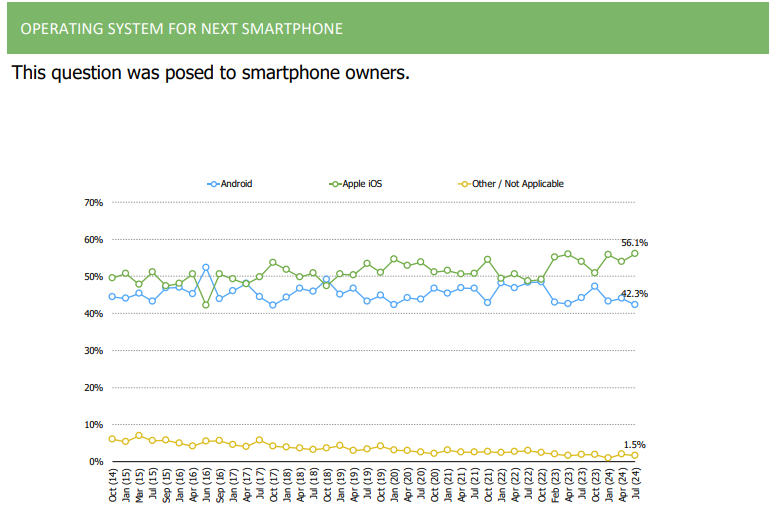
- The share of consumers who plan to choose iOS as their next phone increased and reached a series high in our July wave.
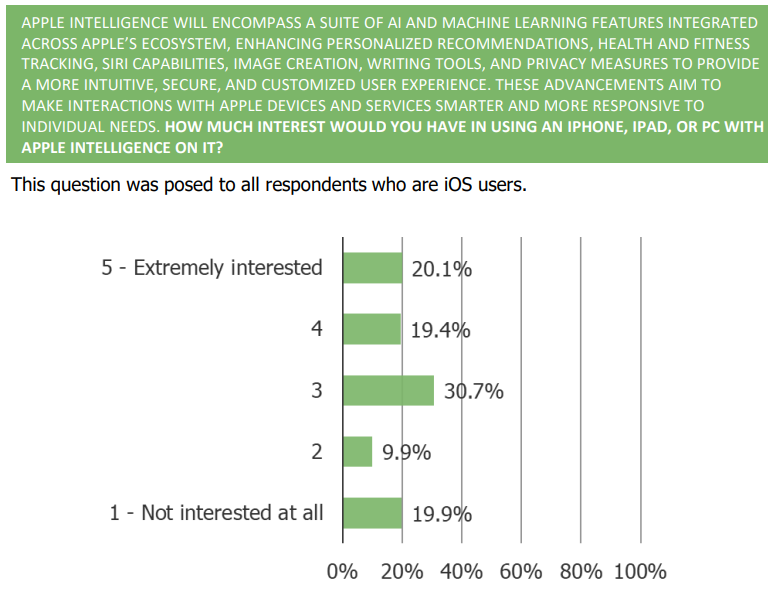
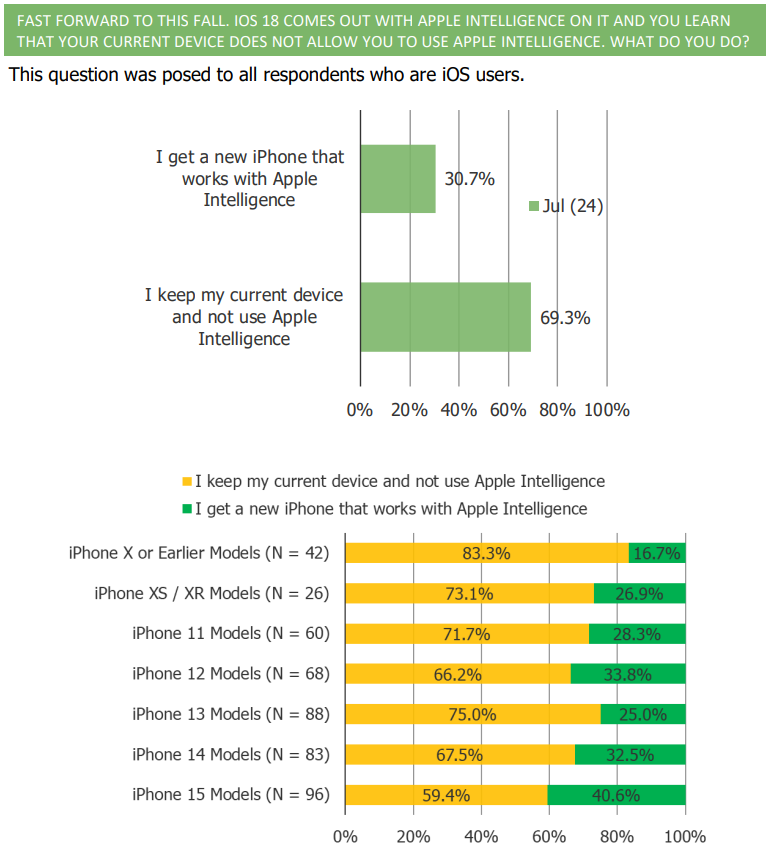
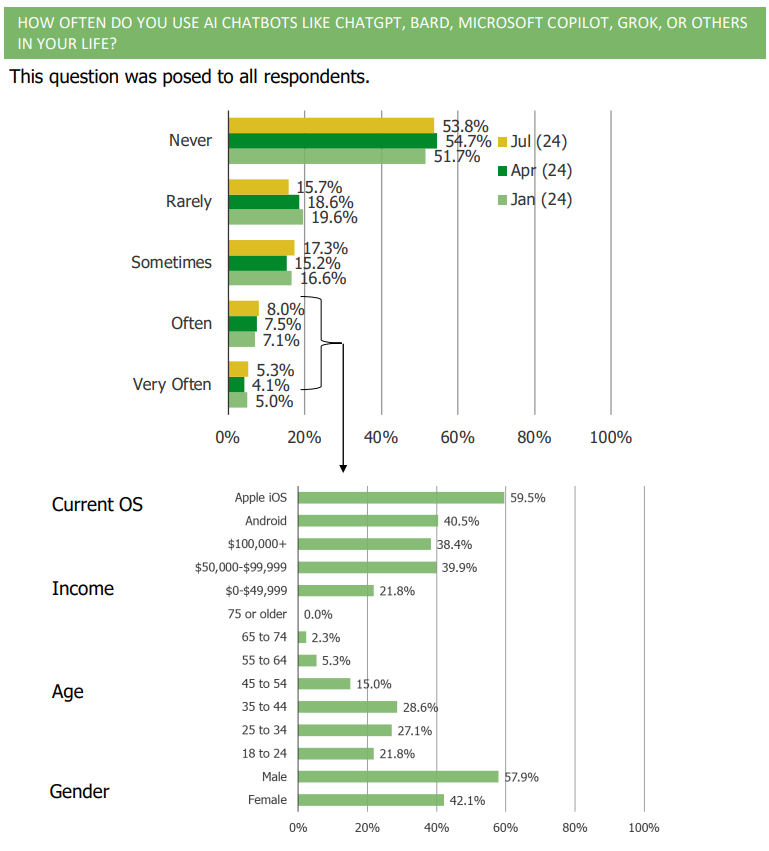
- Consumers in our surveys have been broadly positive toward AI. Adoption has steadily increased with each wave we run and there is a larger cohort who tell us they would potentially refresh hardware if it worked better with AI “depending on what AI can do for them”
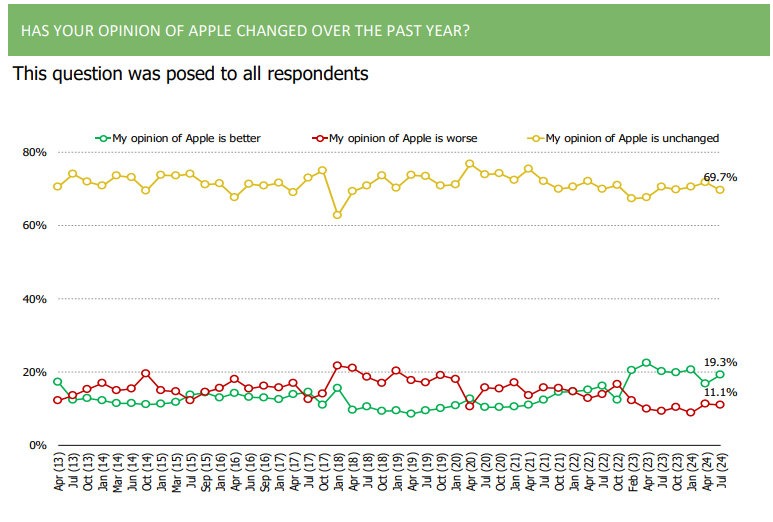
- Consumer opinions toward AAPL have improved, especially in recent surveys.
Charts:
(NFLX) Survey Insights | Account Sharing and Ad Supported Tier
NFLX shares are up 50% over the past year. We have been tracking NFLX and peers with quarterly surveys going back to 2013… so we’ve gotten to know the customer pretty well! Below we highlight some findings from our latest survey related to the two issues we are getting asked about the most recently – account sharing, and the ad-supported tier.
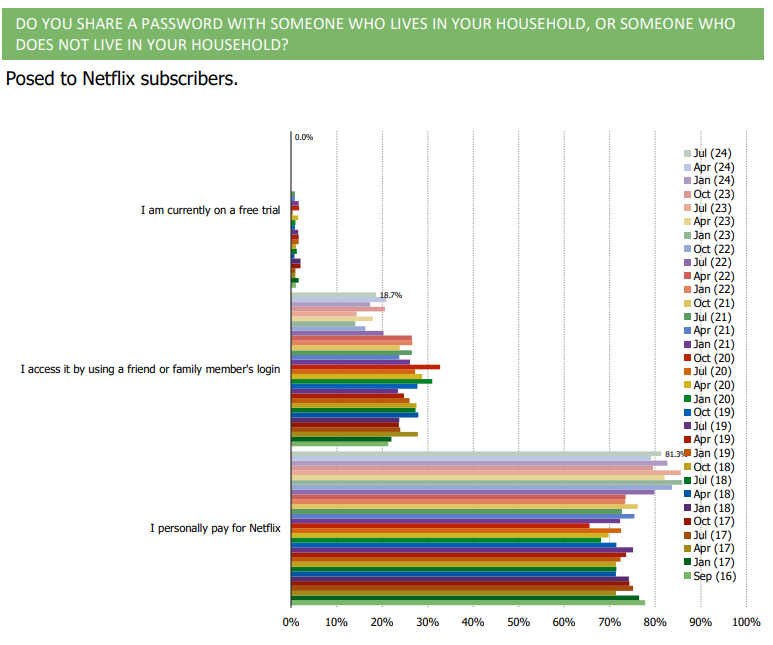
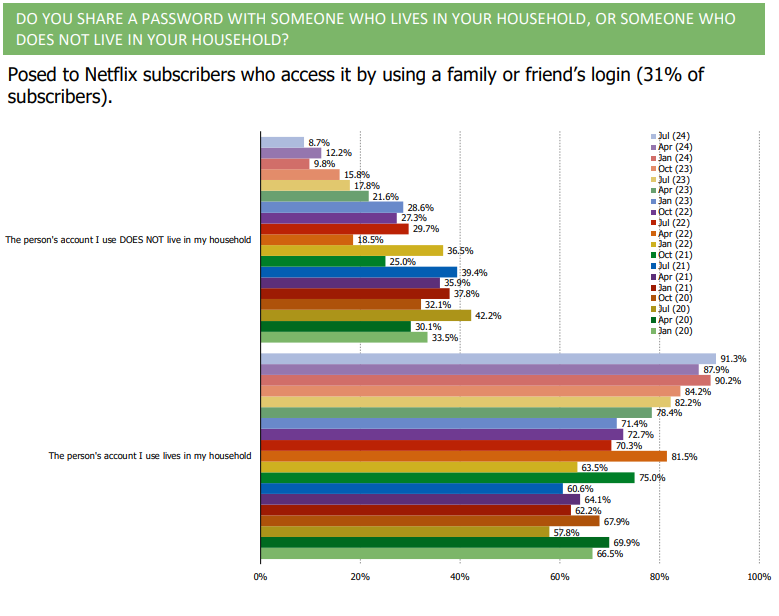
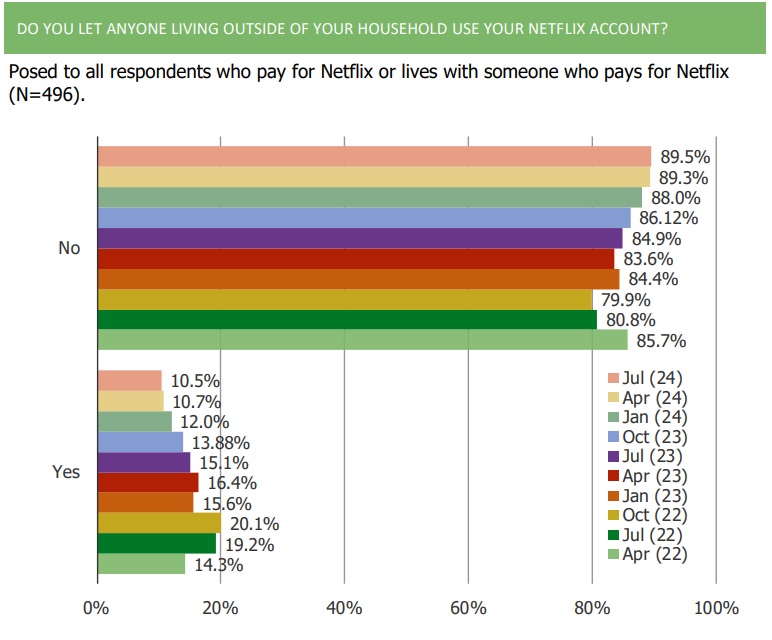
Account sharing is down…
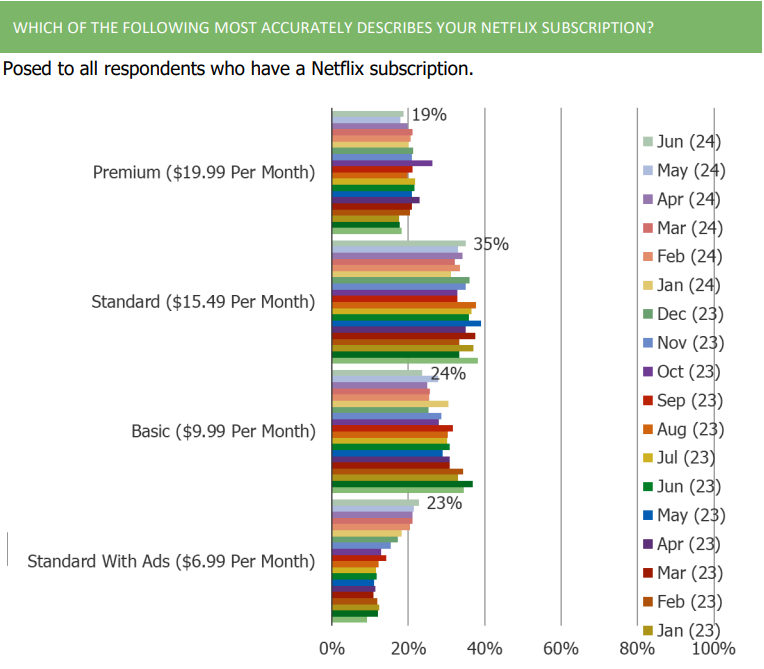
An increasing share of subscribers are on the Standard with Ads Plan…
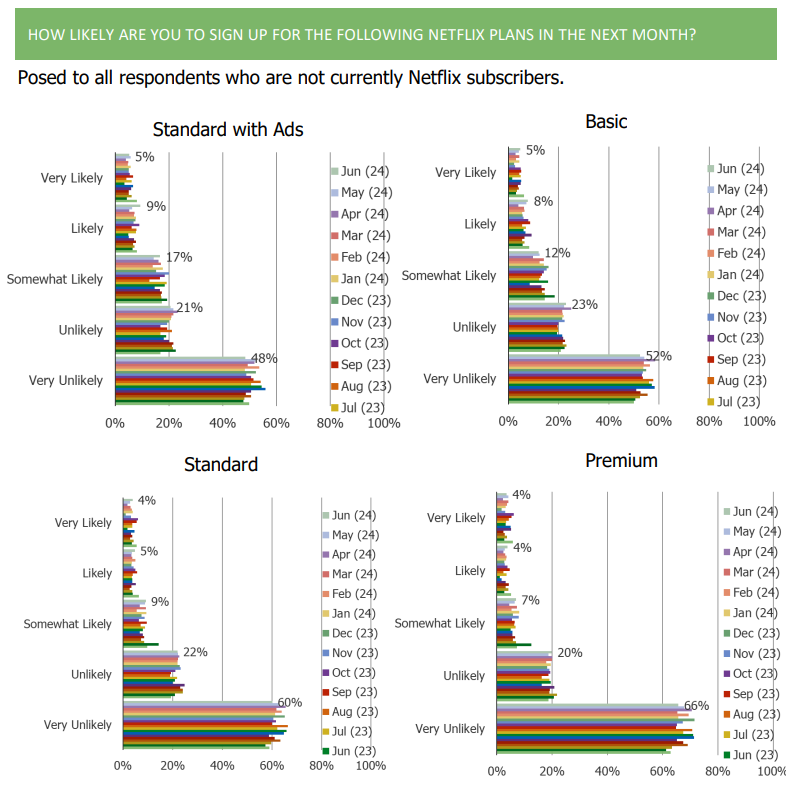
Among non Netflix subscribers, Standard With Ads is the most likely plan to entice them to become customers in the future…
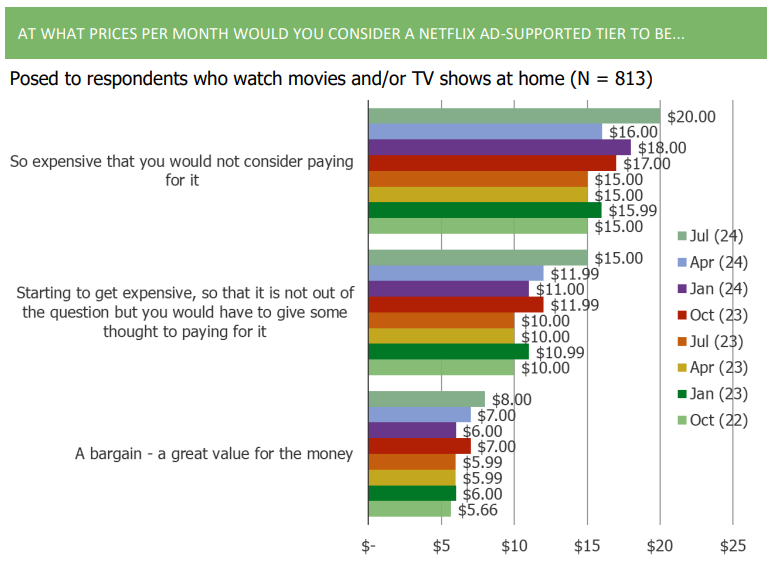
Netflix got the price point right on Standard with Ads, and it is already building pricing power in the tier!
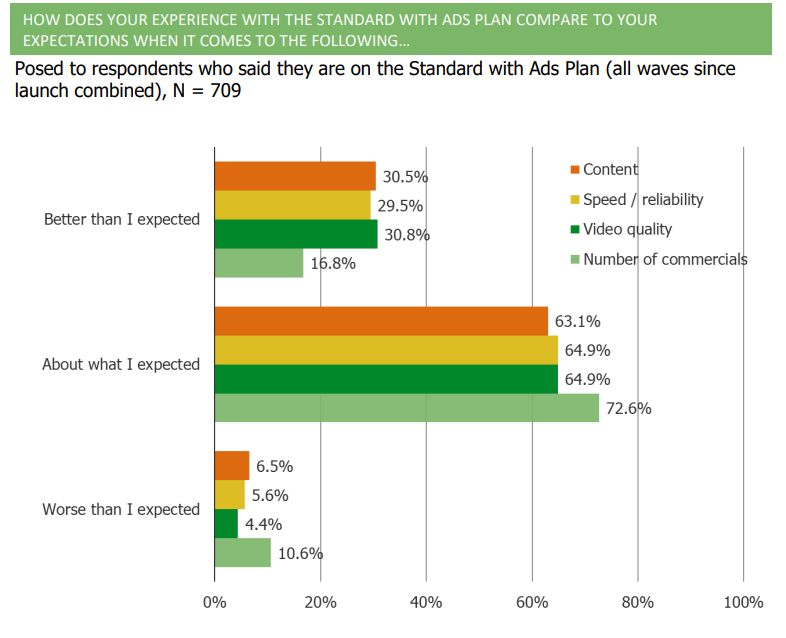
In all facets, Standard with Ads subs say the tier has been better than expected…
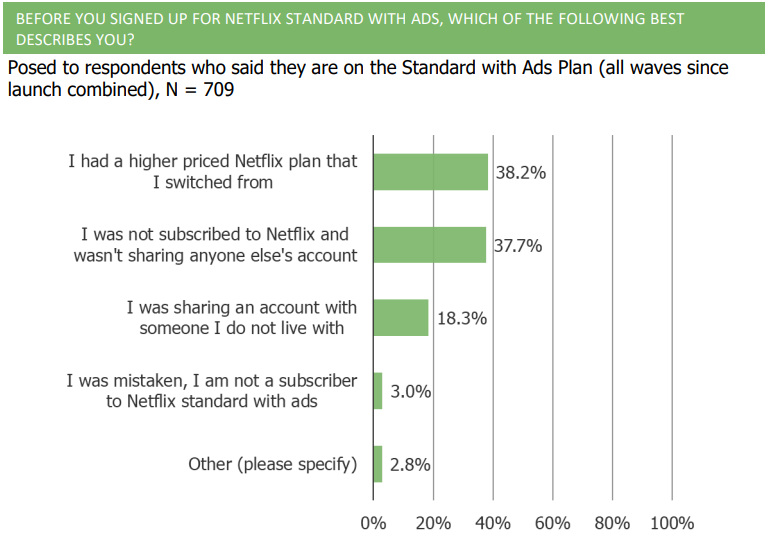
Where did Standard with Ads subs come from? A mixture of higher priced plans, non-subscribers, and folks who were accessing someone else’s account…
For more on Netflix start a free trial to our platform to see more data (summary of key topics covered in our survey below)
Netflix Account Sharing and Usage:
- Do you let anyone living outside of your household use your Netflix account?
- How many people who live outside of your household do you let use your Netflix account?
- What is your relation to the person whose Netflix account you access?
- Who pays for the subscription of the Netflix account you use?
- How important is it to you to be able to share your Netflix account with people who live outside of your home?
- Have you had any trouble accessing the person’s Netflix account you typically use?
- Which of the following would you do if Netflix no longer allowed the person whose account you access to share their account with you for free?
Awareness and Opinions on Ad-Supported Tiers:
- Before taking this survey, were you aware that Netflix has an ad-supported tier with commercials?
- Before taking this survey, were you aware that Disney+ has an ad-supported tier with commercials?
- How likely are you to switch your Netflix subscription to Standard with Ads for $6.99 per month in the next month?
- How likely are you to sign up for the following Netflix plans in the next month?
- Which of the following best describes your Disney+ subscription?
- How likely are you to switch your Disney+ subscription to Basic with Ads for $7.99 per month in the next month?
- How likely are you to sign up for the following Disney+ plans in the next month?
Interest in Streaming Content:
- How much interest do you have in watching the following on Netflix?
- If Netflix took over a mall location near you to create experiences based on Netflix shows, how much interest would you have in visiting?
- How much interest would you have in watching live sports streamed on Netflix?
- If Netflix started offering more live sports events, would that impact your likelihood of remaining a Netflix subscriber?
Password Sharing Behavior:
- Do you share a password with someone who lives in your household, or someone who does not live in your household?
- Have you been forced to enter a code to re-authenticate in the Netflix app on any device you use to watch Netflix during the past 6 months?
- When asked to re-authenticate to get into Netflix, what did you do?
Consumer Spending and Subscription Dynamics:
- How many streaming video services do you think is the right number to be paying for at the same time?
- How much do you think is appropriate to spend on streaming video services, in total, per month?
- At what monthly price point would you decide to cancel your Netflix subscription?
- How much do you spend on streaming video services per month?
User Experience with Ad-Supported Plan:
- How does your experience with the Standard with Ads plan compare to your expectations when it comes to various factors?
- Before you signed up for Netflix Standard with Ads, which of the following best describes you?
- Thinking about Netflix’s ad-supported tier, how many commercials per hour would you consider to be reasonable?
Future Subscription Plans and Expectations:
- For how much longer do you expect to be a Netflix subscriber?
- How likely do you think it is that Netflix will increase prices in the next three months?
- In general, how often do you expect Netflix to increase their prices?
Former Subscriber Insights:
- Former Netflix subscribers – why did you cancel?
- When were you most recently forced to re-authenticate to get into Netflix?
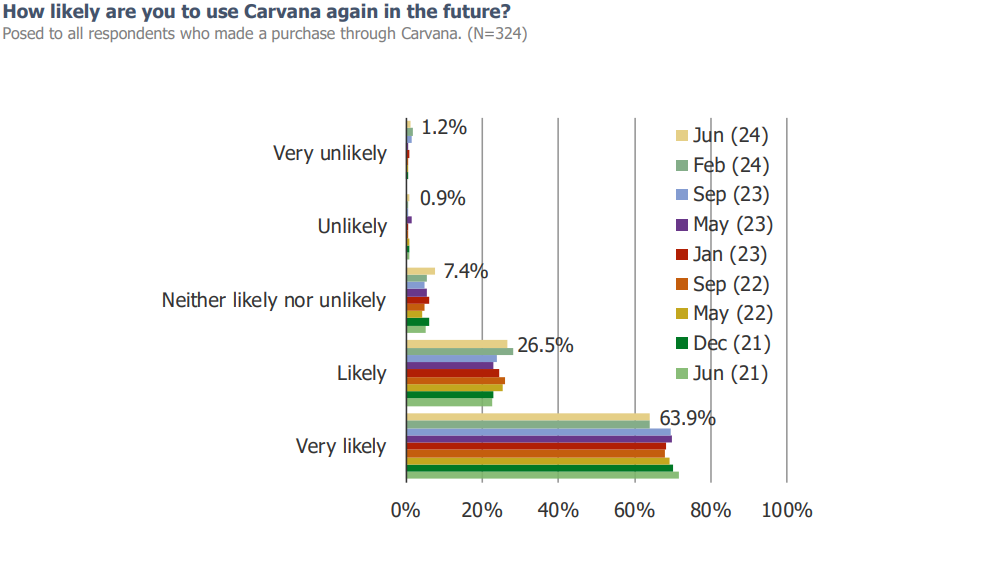
(CVNA) What Has Been Working
Below are highlights from the 9th volume of our 10,000N deep-dive survey on CVNA (132 page survey report). We will soon be launching wave 10. If you are interested in a spot in our group custom survey, get in touch (pgorynski@bespokeintel.com or 914-630-0512).
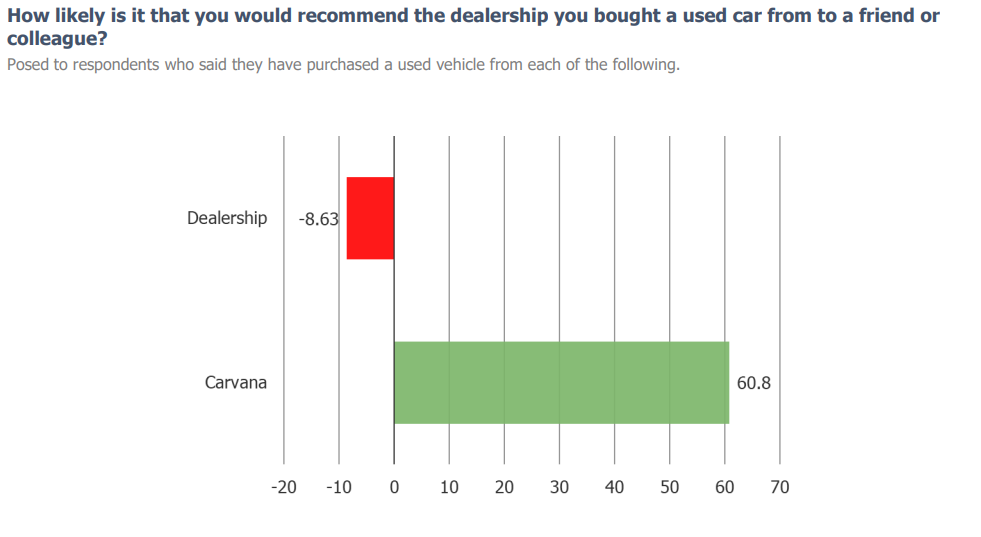
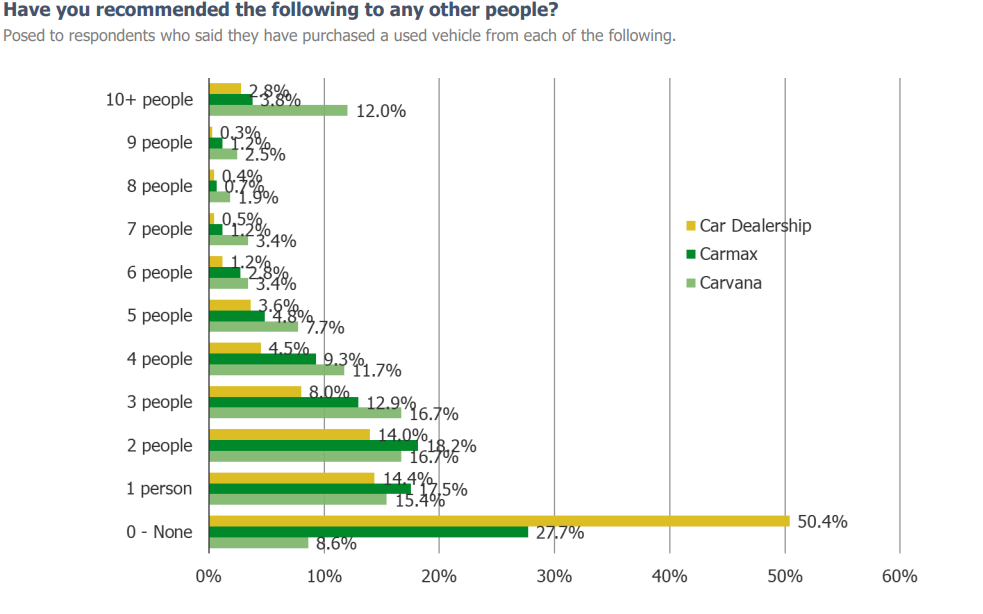
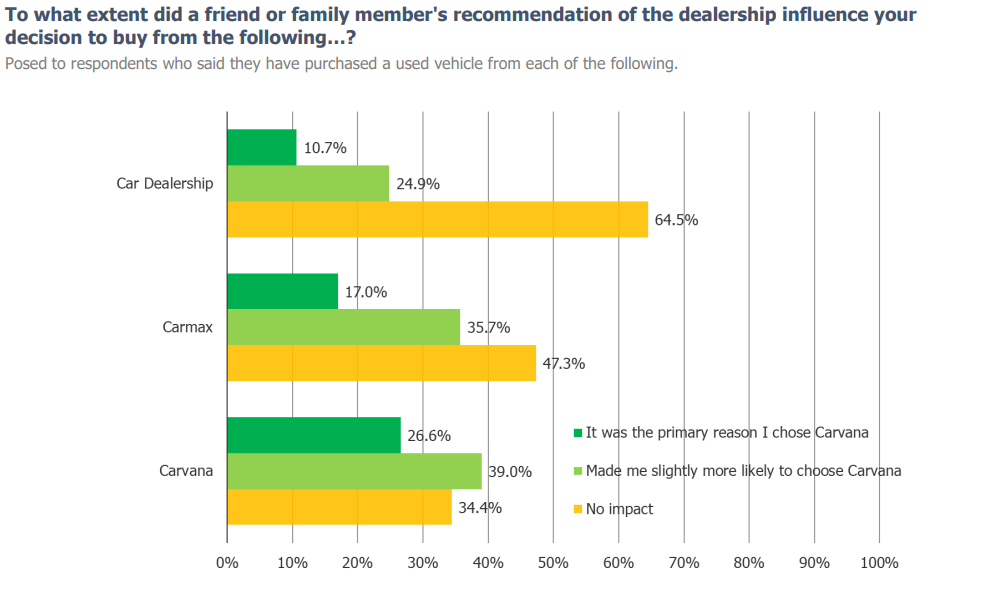
Carvana gets much better growth from WOM (Word of Mouth) than alternatives…
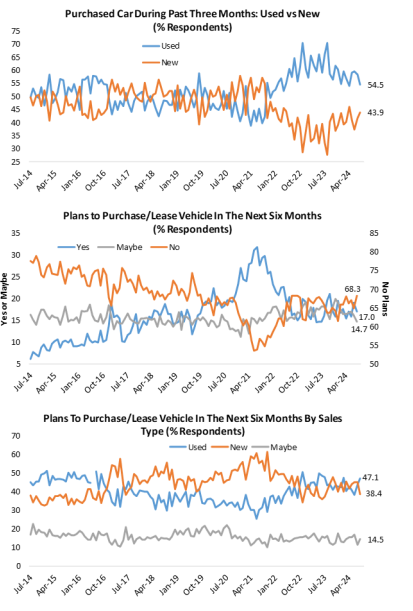
Consumers have been favoring used cars over new, recently…
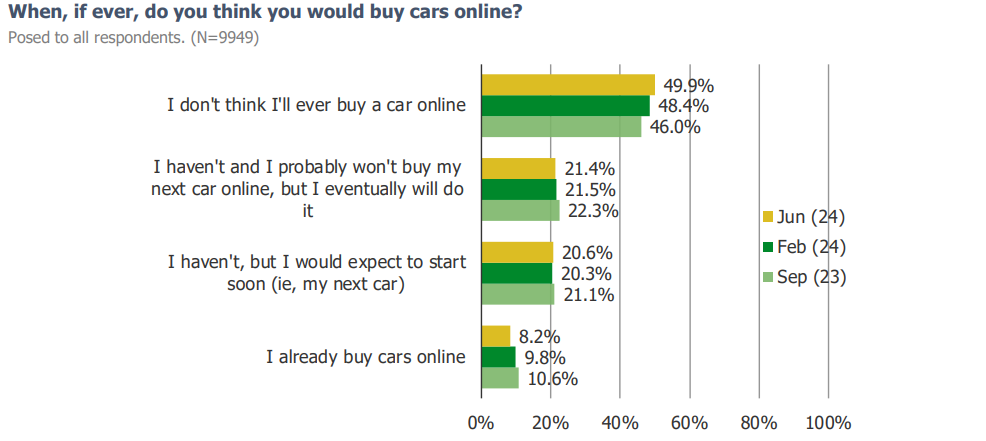
We are still in the early innings of consumers buying cars online, but at least half of consumers (!) think they will buy cars online eventually…
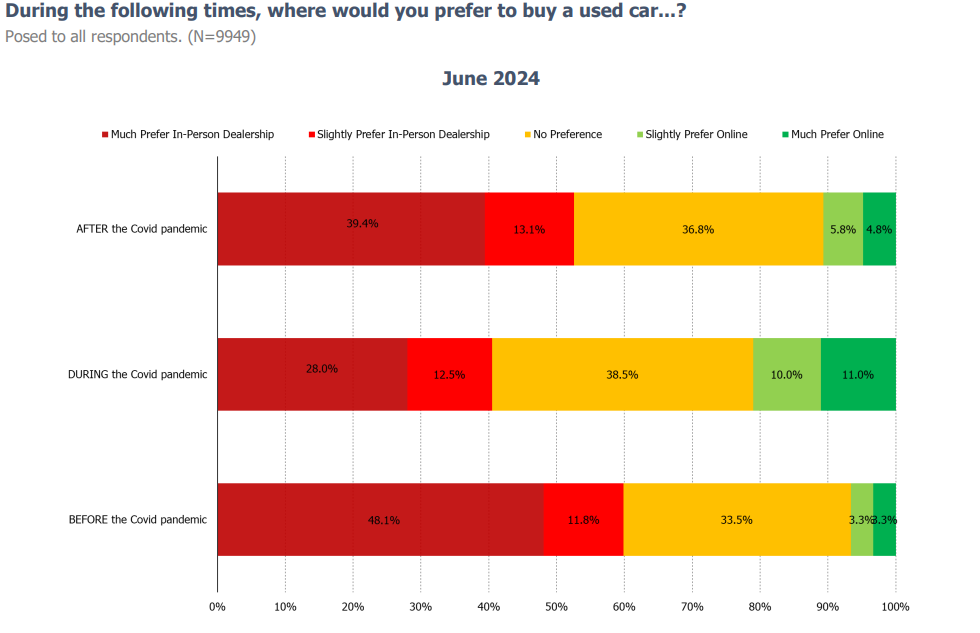
Ignoring the noise of the pandemic, the share who prefer online now (post pandemic) compared to pre-pandemic has grown…
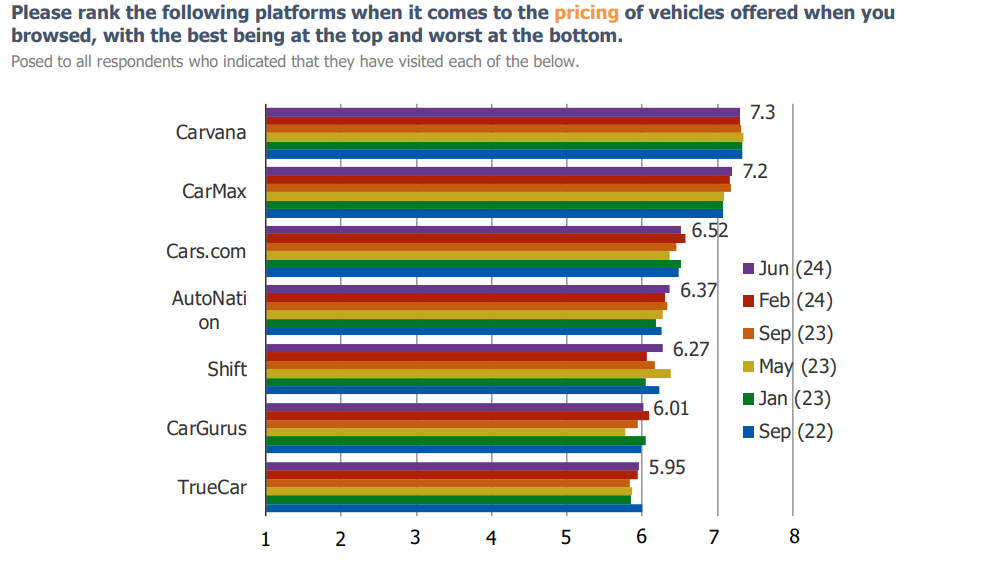
CVNA is positioned well competitively against alternatives in the eyes of consumers…
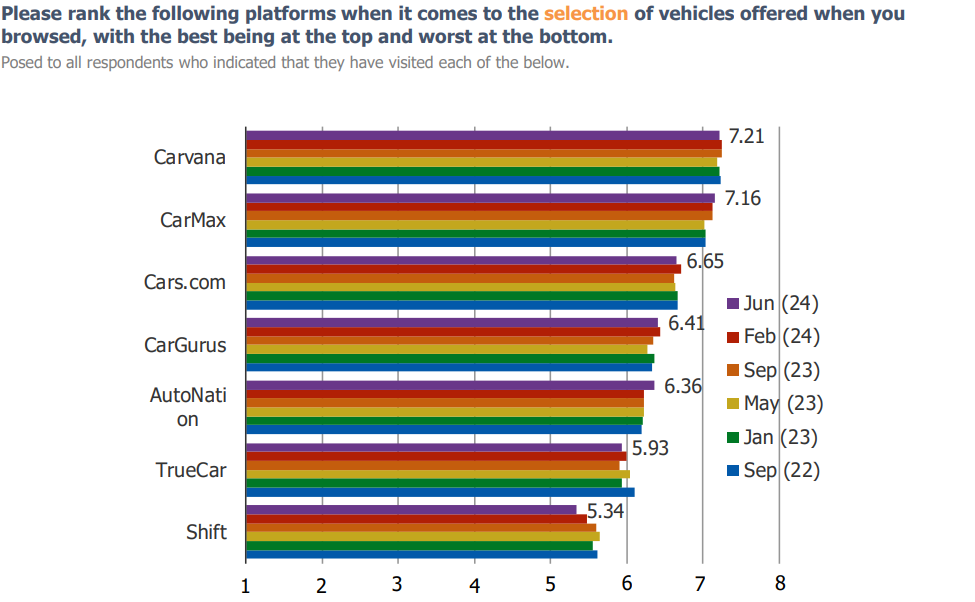
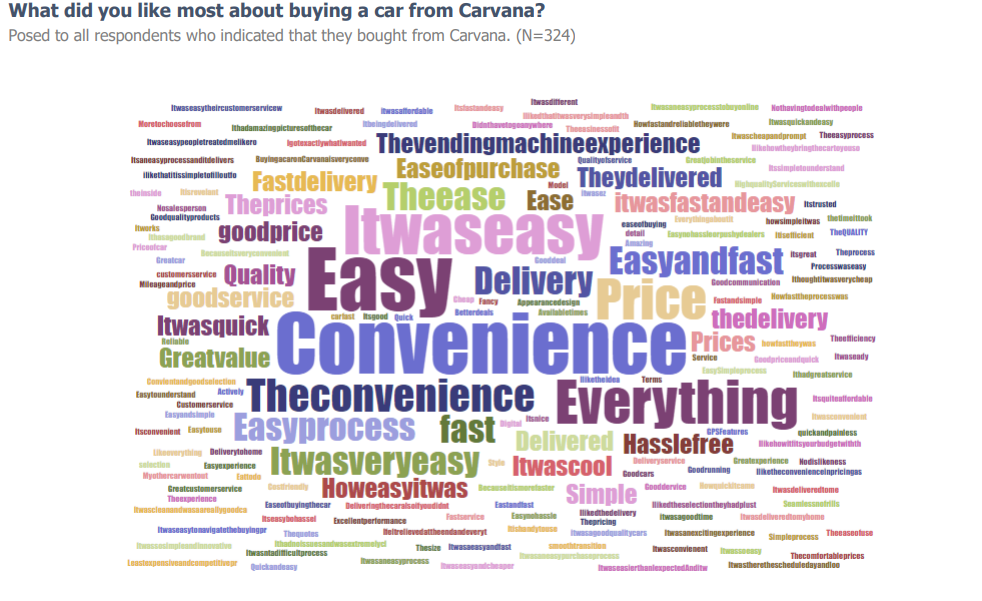
The value proposition to consumers is clear and well-defined. Consumers can buy intoo what they understand and value. Convenience…
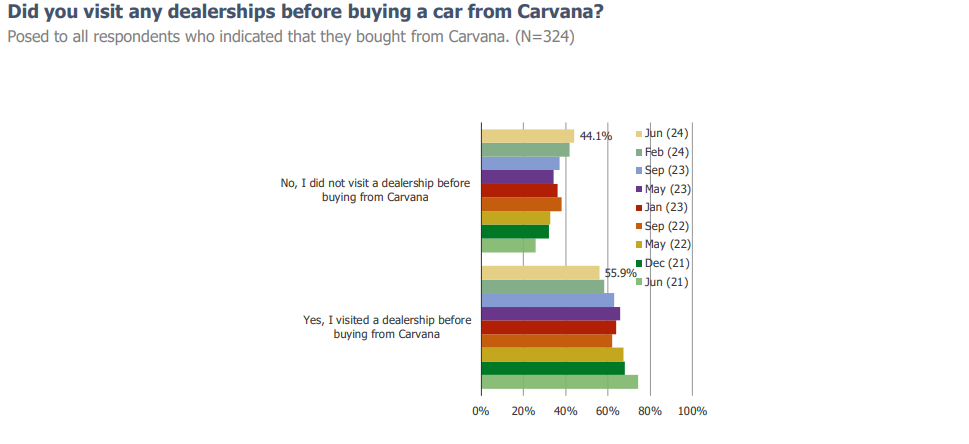
As time has marched on, Carvana customers have been increasingly going to Carvana and avoiding a trip to the dealership altogther…
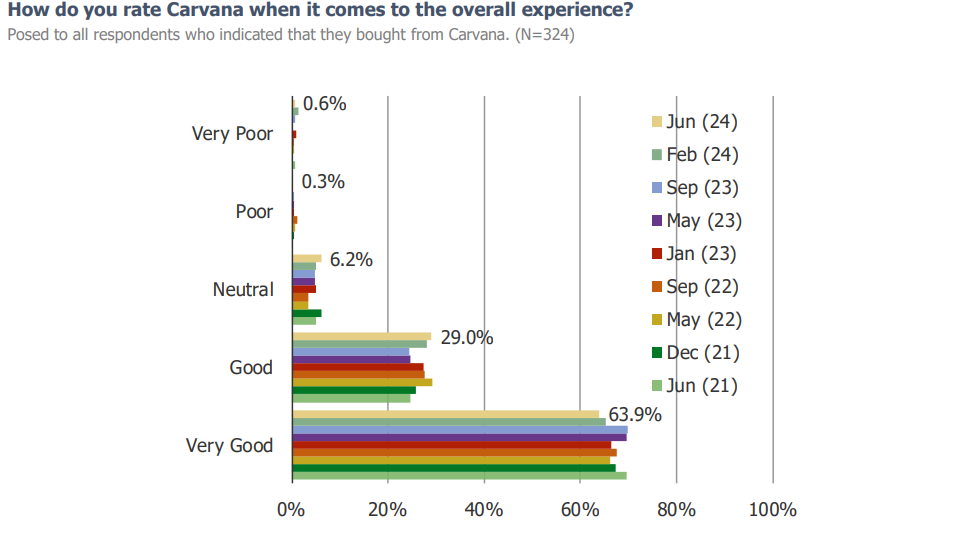
Customer satisfaction is very high…
Likelihood of retaining customers for a future purchase is high…
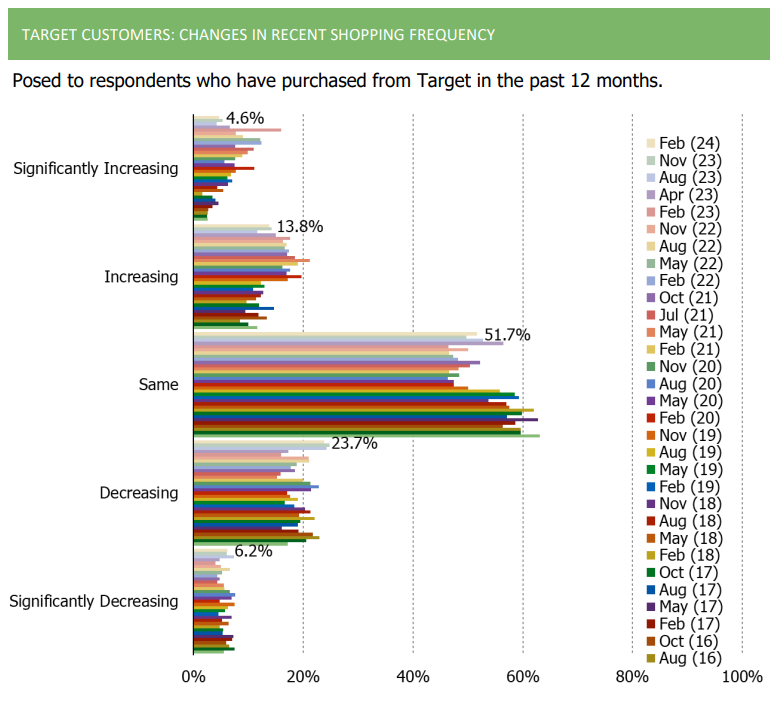
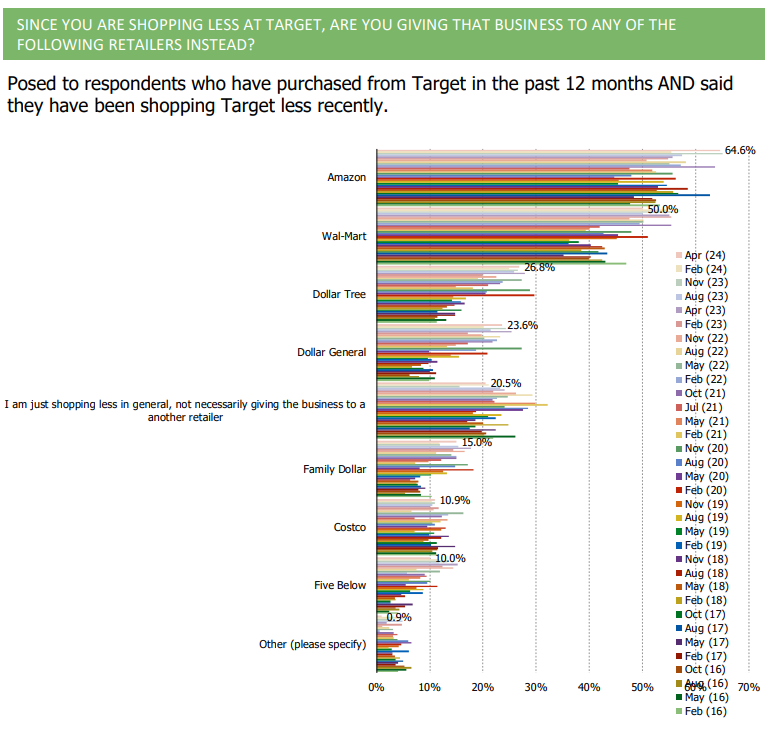
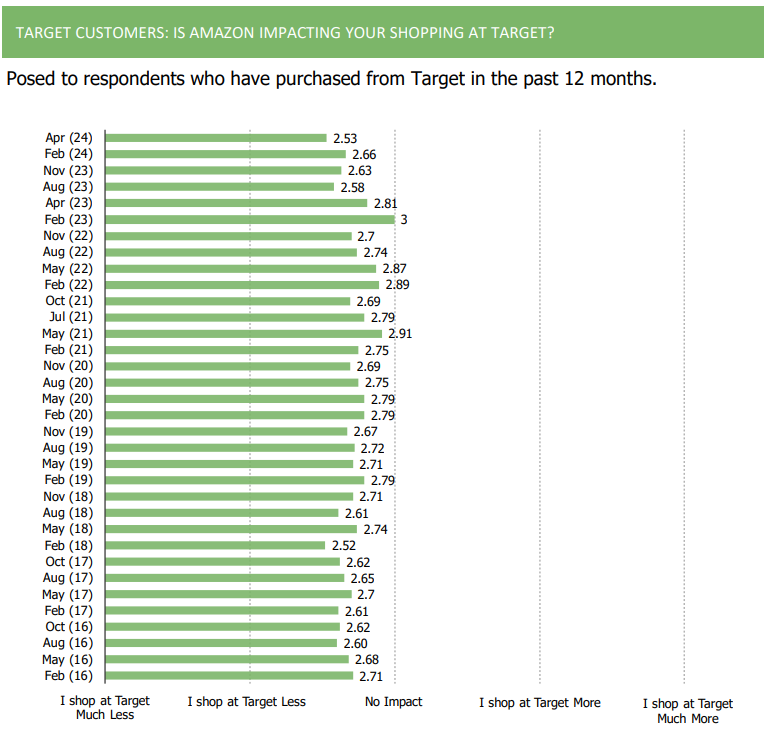
Let The Big Dog (AMZN) Eat (TGT)
We just wrapped up the 34th volume of our quarterly survey focused on low cost retailers (WMT, TGT, COST, dollar stores, etc). Sharing a few charts below that highlight an interesting trend that has emerged related to competition between TGT and AMZN…
Survey Details:
Volume: 34 (Quarterly)
N Size: 1,000+ each wave
Tickers: WMT, TGT, COST, Dollar Stores
Pages: 44
If you are a client, head over to our research portal to view the full report.
If you are not a client and want to see more…
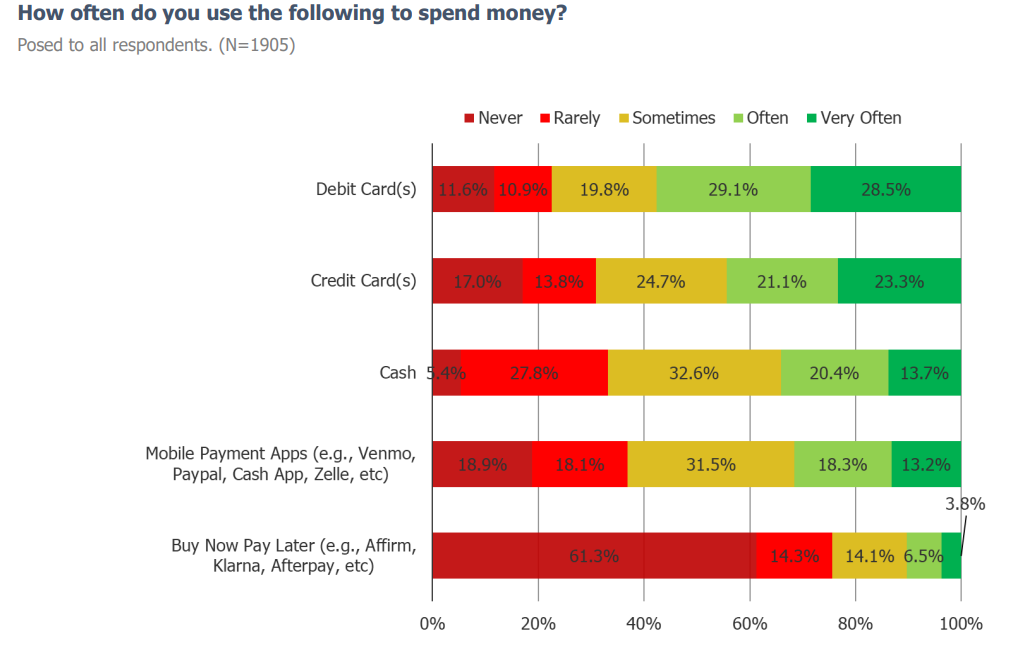
Credit Card Trends | Top Three Takeaways
1. Debit cards were the most popular way of spending money in our survey.
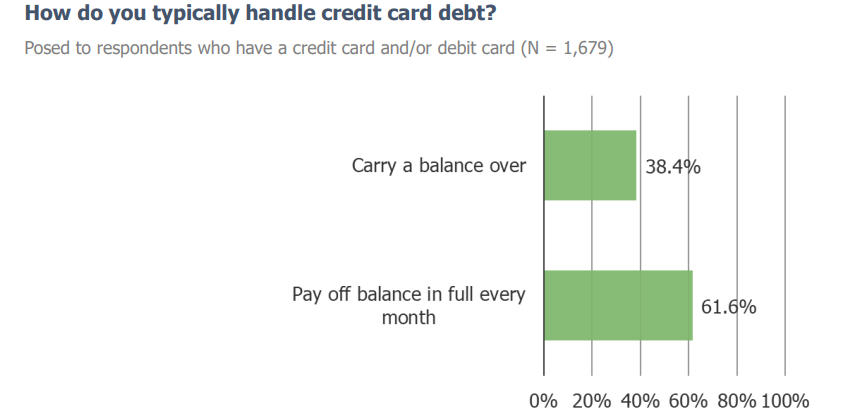
2. 61.6% of respondents report paying off their credit card balance in full every month.
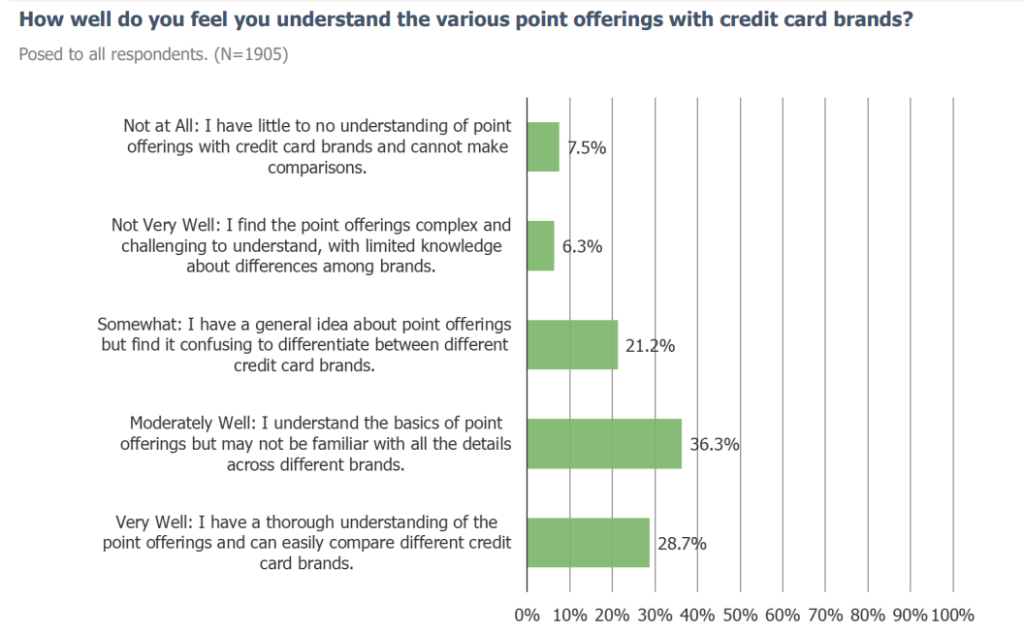
3.A plurality of respondents report understanding their various point offerings with credit card brands very well or moderately well.
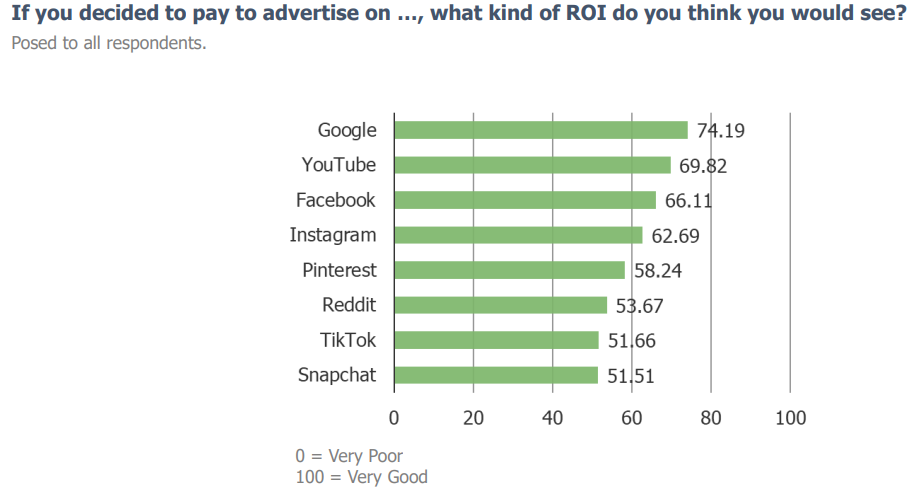
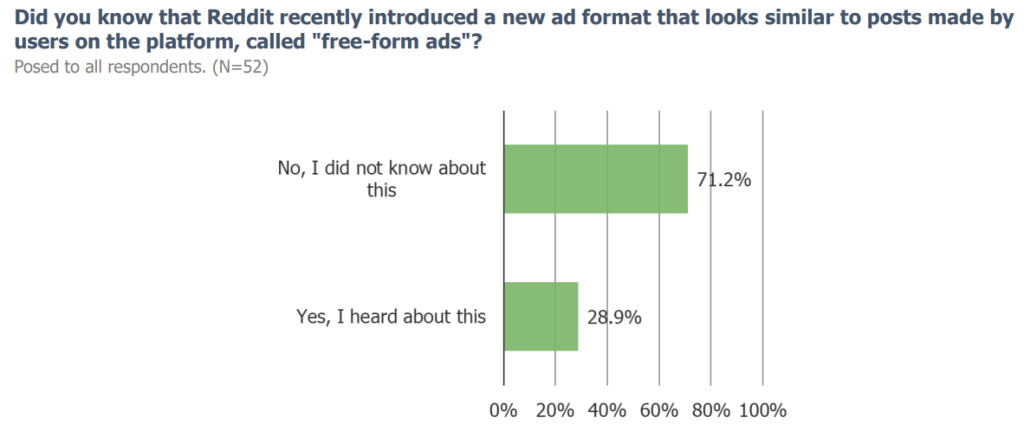
SMB Survey | Top Three Takeaways
1. SMB owners believe that Google would provide the best ROI for an advertising campaign.
2. The top platform that SMBs choose to advertise on is Facebook.
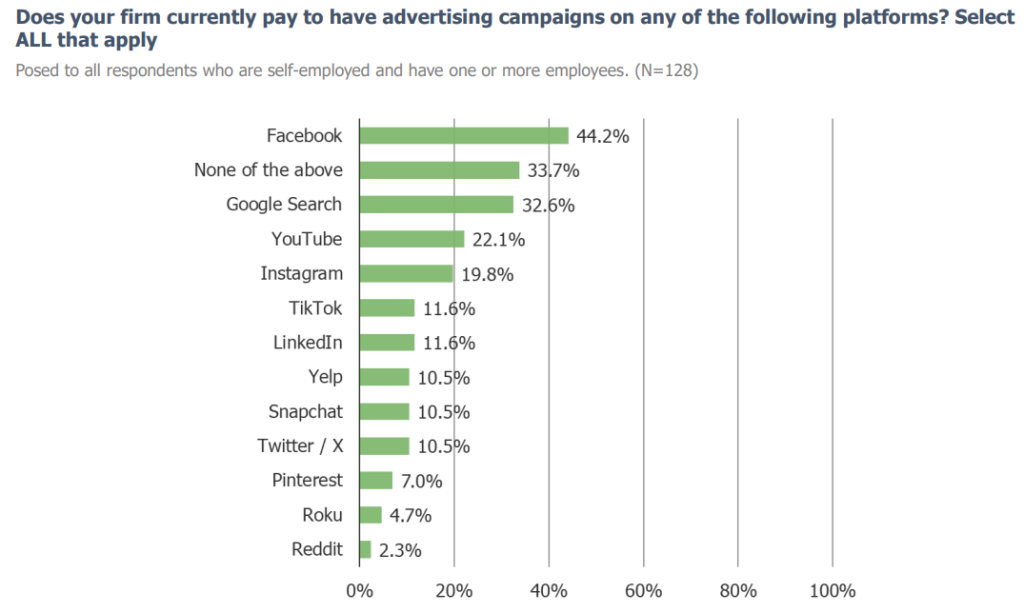
3. A plurality of SMB owners were unaware of Reddit’s Free-Form Ad format.
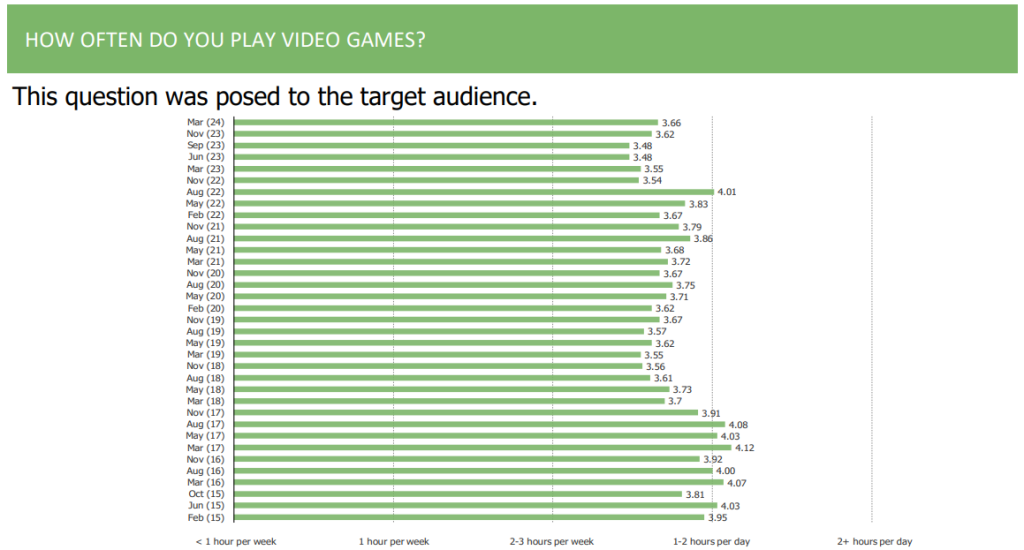
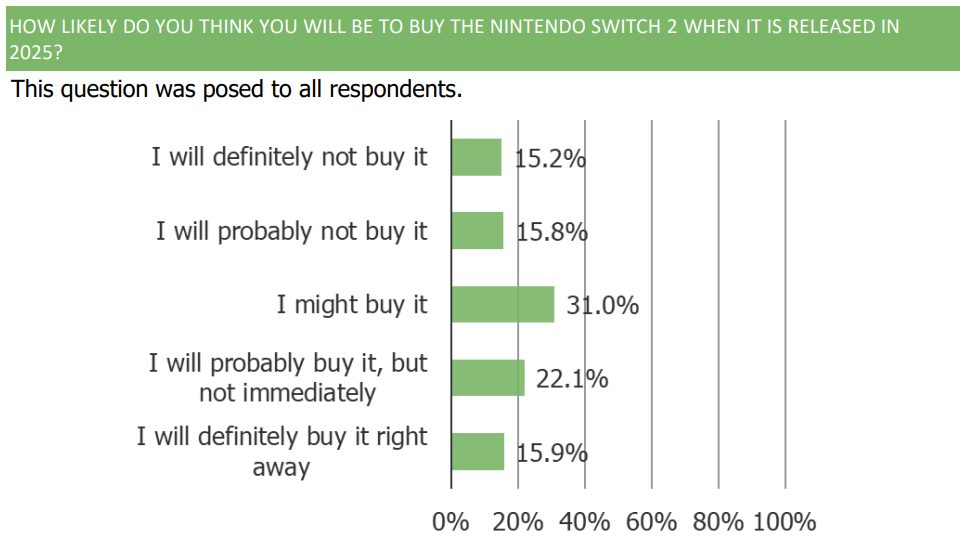
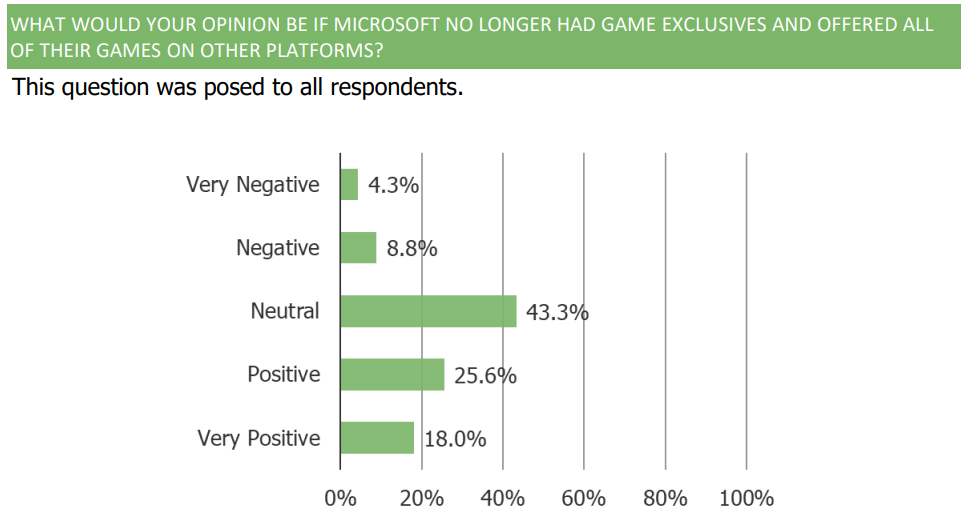
Video Games | Top Three Takeaways
1. Video game playing frequency has improved over this quarter.
2. There is appetite for the upcoming Nintendo Switch console release in 2025, with a
mixture of responses among those with interest ranging from folks who might buy it,
some who will probably buy it but not immediately, and some who will definitely buy it
right away.
3. Gamers broadly have a net favorable view of Microsoft making Xbox exclusives available on other platforms.
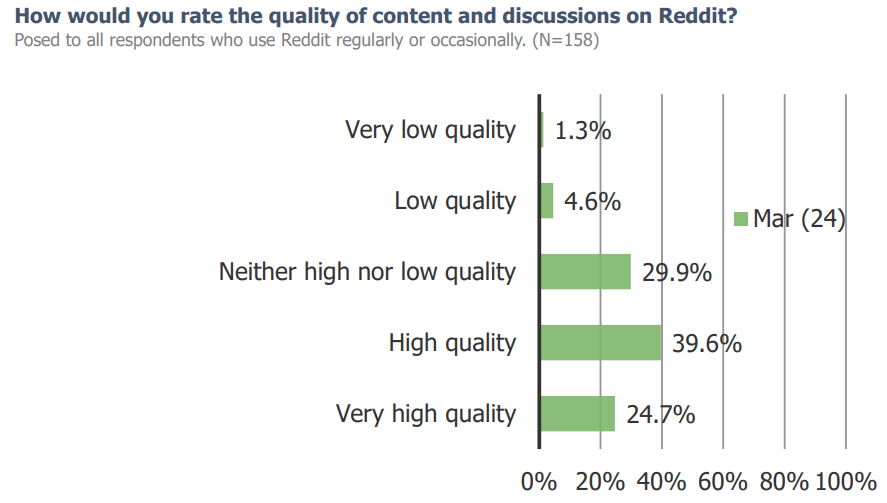
RDDT | Top Three Takeaways
1. Consumers have a positive rating of the quality of content and discussions on Reddit.
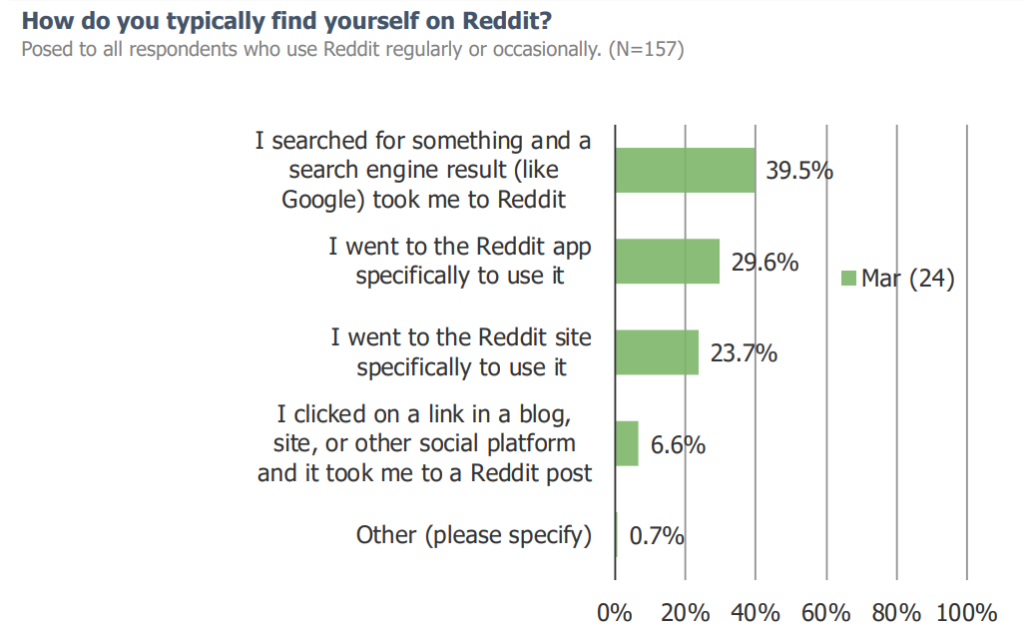
2. A plurality of Reddit users typically find themselves on Reddit after a Google search (ie, makes engagement reliant on placement and emphasis in the Google search algorithm).
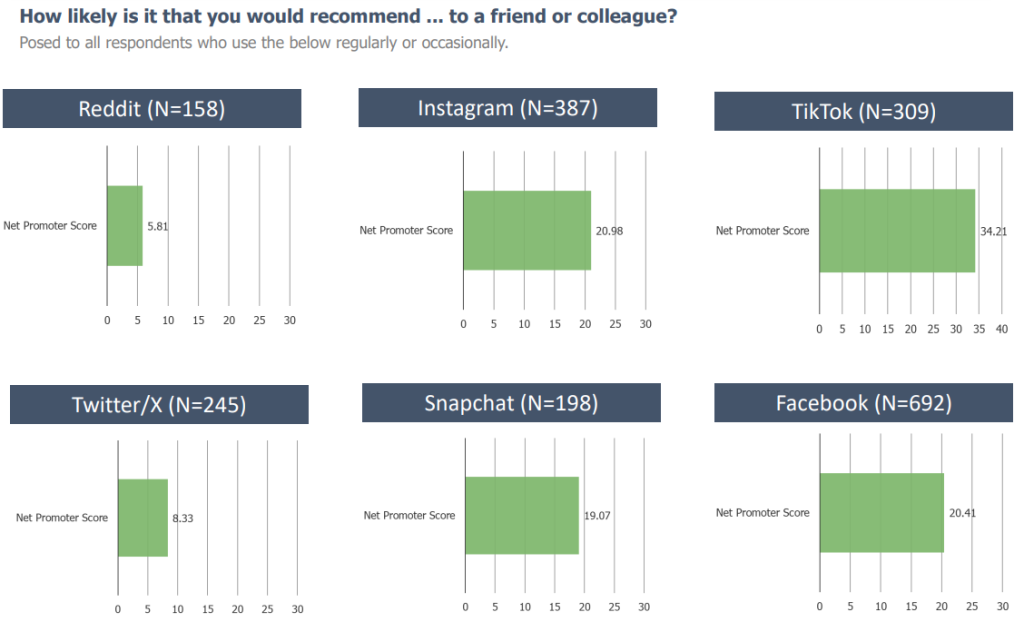
3. Consumer NPS is lower than all other social platforms we test.
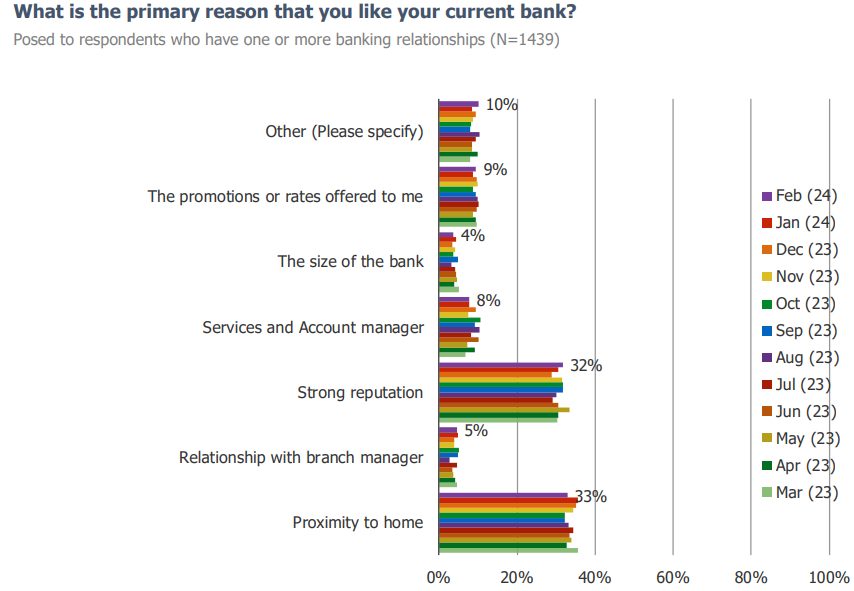
US Banking | Top Three Takeaways
1. The top two reasons for why respondents like their current bank is because of its proximity to their home and the reputation that the bank holds.
2. The vast majority (88%) of respondents have not made any changes to their banking relationships in the past 30 days.

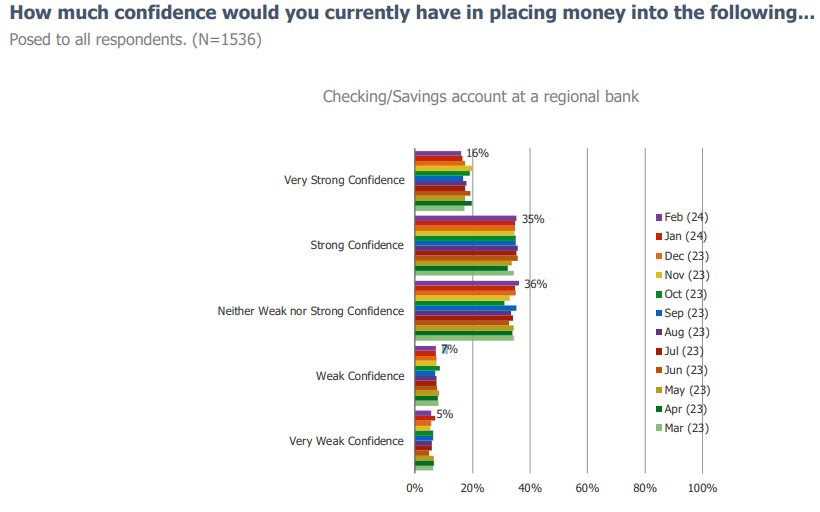
3. A plurality of respondents have a generally strong level of confidence in keeping a checking or savings account with a regional bank.
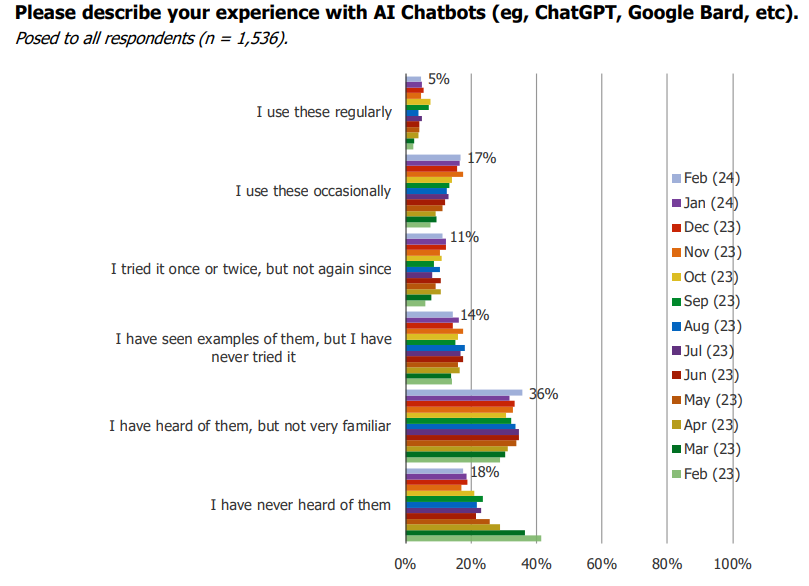
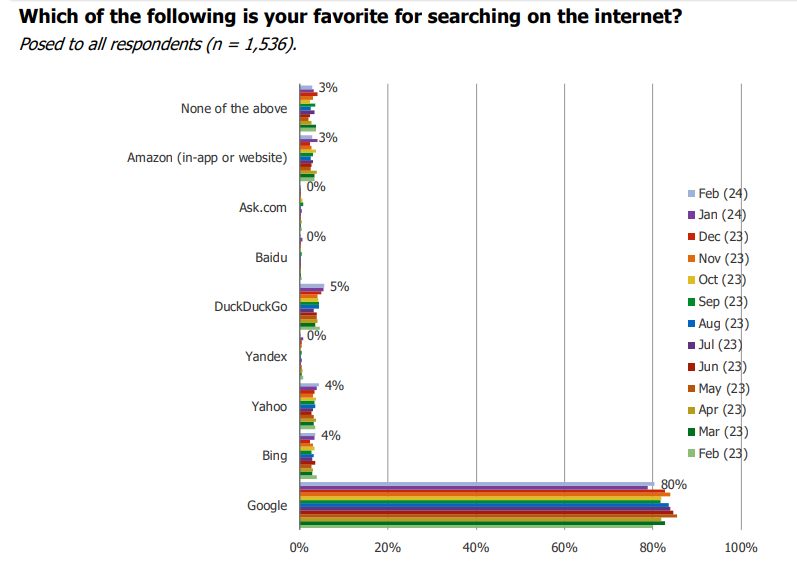
Search & AI | Top Three Takeaways
1. The percentage of consumers who are aware of AI Chatbots continues to increase.
2. When asked about what platform they use for internet search purposes, the vast majority of respondents answered with Google.
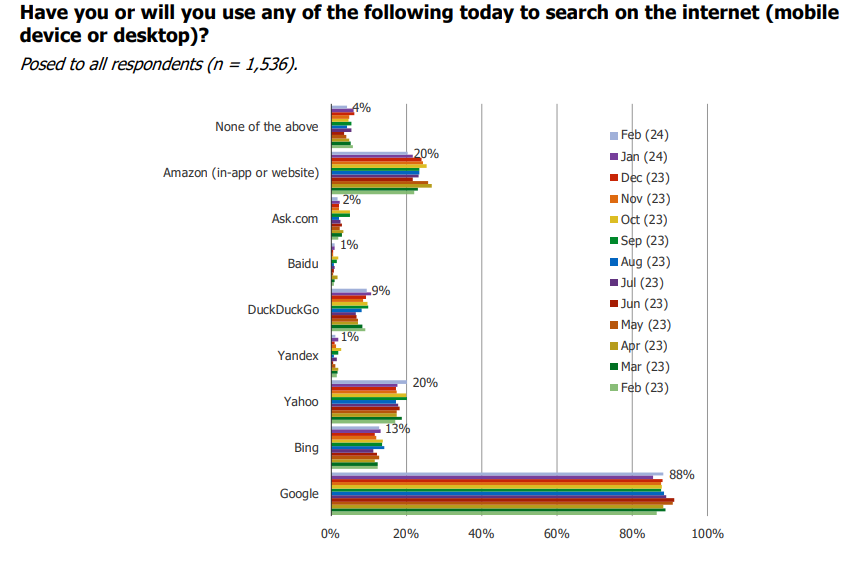
3. Google remains the most popular web search platform by a large margin.
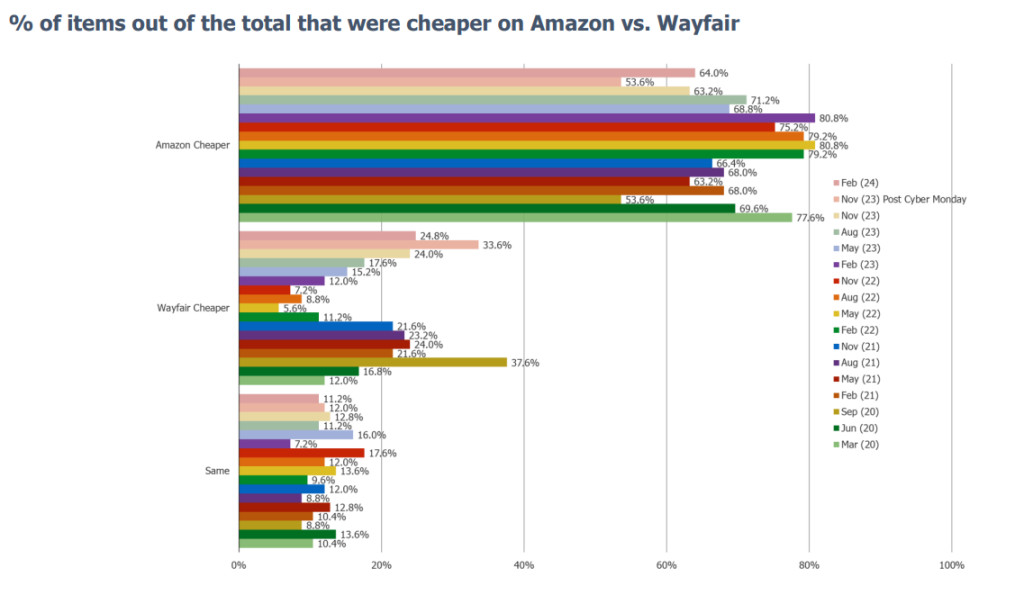
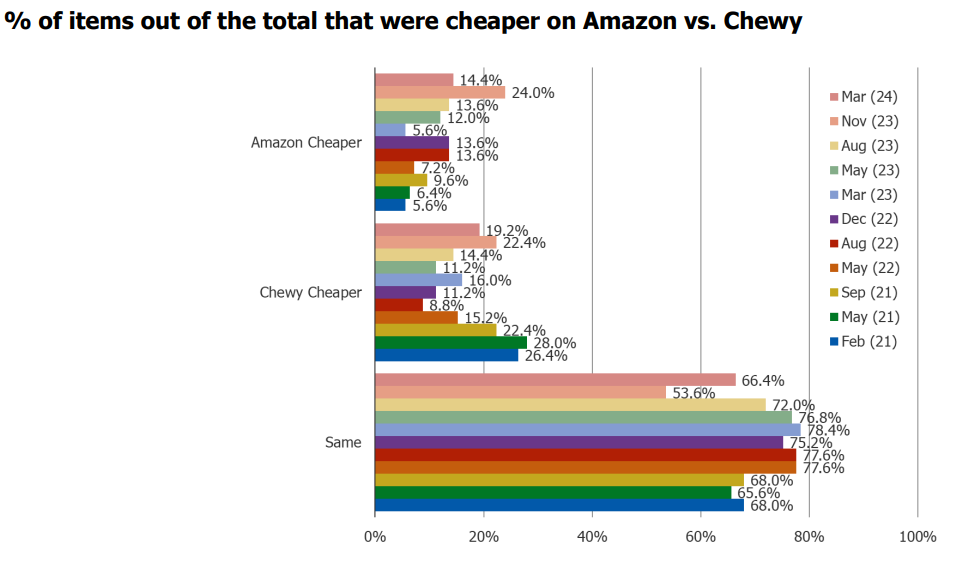
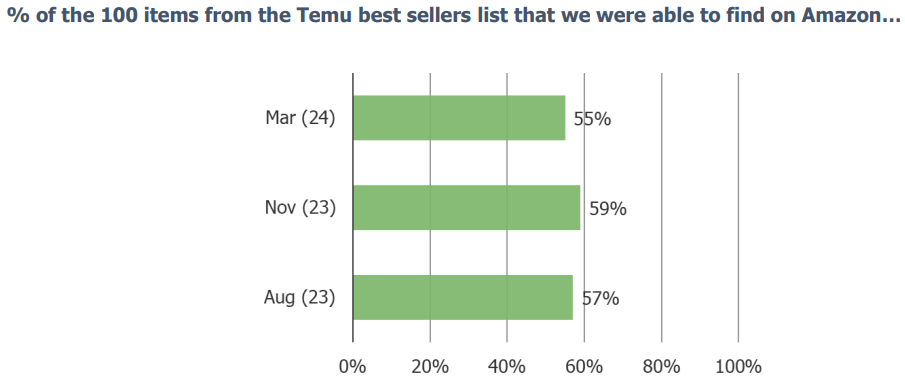
Amazon Pricing Analysis | Top Three Takeaways
1. Over recent quarters, Wayfair has progressively been getting “cheaper” on a growing percentage of identical items found on both Amazon and Wayfair. Amazon is still cheaper more often than not.
2. The share of identical items found on Amazon and Chewy that are cheaper on Chewy was basically unchanged q/q.
3. Around 55-60% of the best sellers that we pull for analysis from Temu are also available on Amazon. When we find identical items, Temu is cheaper 95% of the time, and by a large amount (Amazon is usually more than double the price).
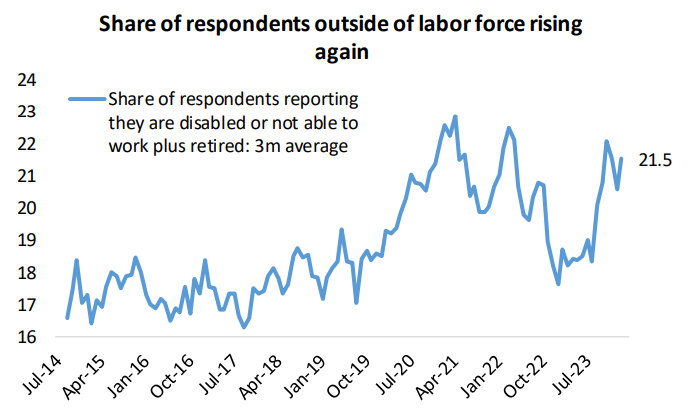
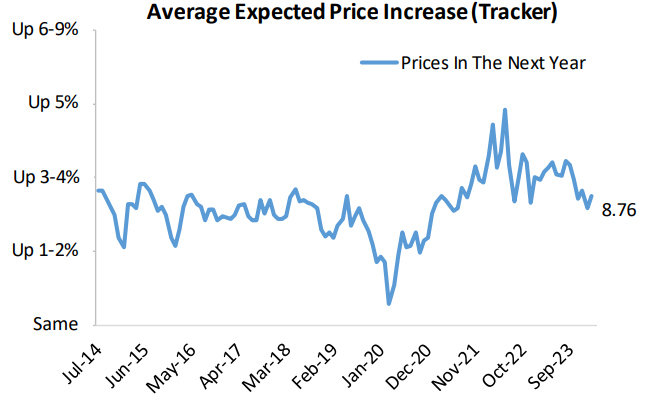
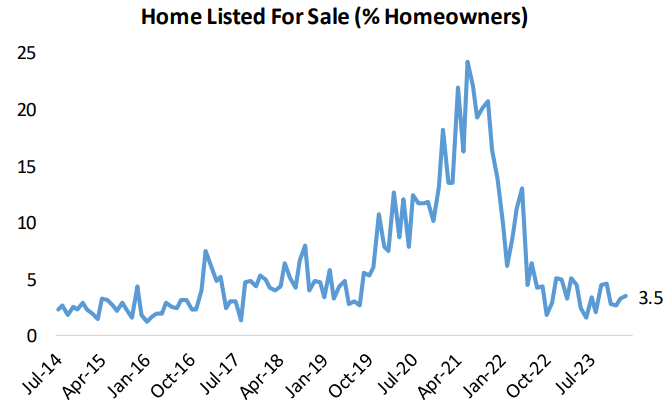
Macro Update | Top Three Takeaways
1. Inflation concerns have retreated rapidly and appear to have returned to pre-COVID norms.
2. Very few respondents report their home listed for sale, a sign that the housing market remains constrained.
3. Over the last six months our survey reflects a sudden significant uptick in workers leaving the labor force.